Estimated Value: $102,000 - $172,000
4
Beds
2
Baths
936
Sq Ft
$134/Sq Ft
Est. Value
About This Home
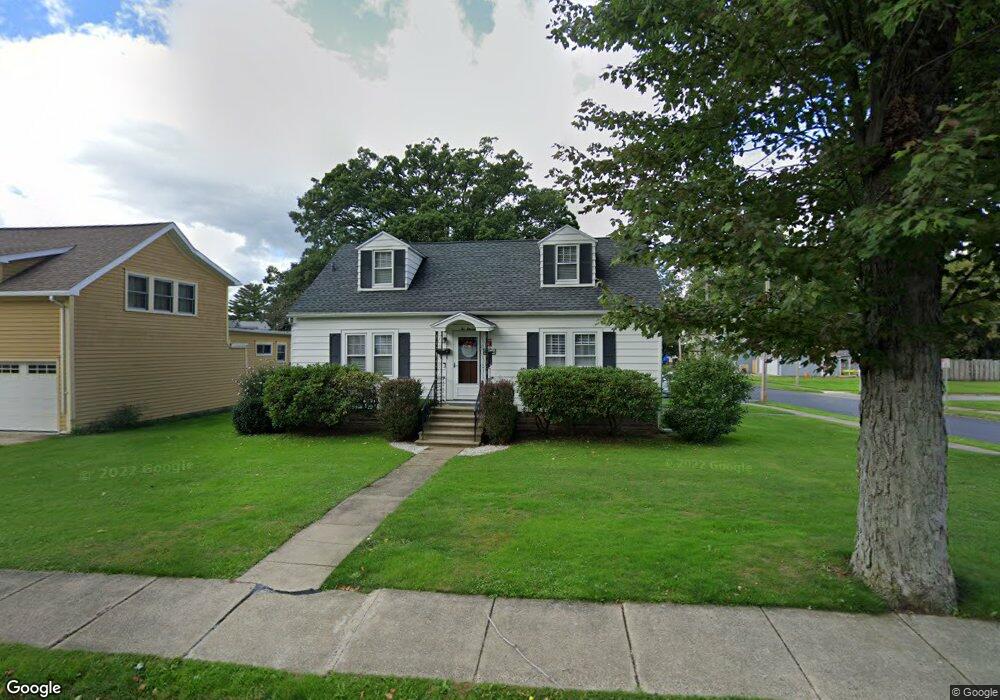
This home is located at 211 Chestnut St, Olean, NY 14760 and is currently estimated at $125,291, approximately $133 per square foot. 211 Chestnut St is a home located in Cattaraugus County with nearby schools including Olean Intermediate-Middle School, Olean Senior High School, and New Life Christian School.
Ownership History
Date
Name
Owned For
Owner Type
Purchase Details
Closed on
Sep 13, 2011
Sold by
Lent Robert
Bought by
Lent Robert
Current Estimated Value
Home Financials for this Owner
Home Financials are based on the most recent Mortgage that was taken out on this home.
Original Mortgage
$68,000
Outstanding Balance
$43,635
Interest Rate
4.58%
Mortgage Type
Purchase Money Mortgage
Estimated Equity
$81,656
Purchase Details
Closed on
Jul 15, 2011
Sold by
Skouson Eric
Bought by
Lent Robert
Home Financials for this Owner
Home Financials are based on the most recent Mortgage that was taken out on this home.
Original Mortgage
$68,000
Outstanding Balance
$43,635
Interest Rate
4.58%
Mortgage Type
Purchase Money Mortgage
Estimated Equity
$81,656
Purchase Details
Closed on
Sep 12, 2002
Sold by
Filbert Eric G
Bought by
Skouson Eric B
Purchase Details
Closed on
Sep 11, 2002
Sold by
Filbert Eric G
Bought by
Skouson Eric B
Create a Home Valuation Report for This Property
The Home Valuation Report is an in-depth analysis detailing your home's value as well as a comparison with similar homes in the area
Home Values in the Area
Average Home Value in this Area
Purchase History
| Date | Buyer | Sale Price | Title Company |
|---|---|---|---|
| Lent Robert | -- | Gregory Shemeld | |
| Lent Robert | $60,000 | Gregory Shened | |
| Skouson Eric B | $72,500 | John Hasslinger | |
| Skouson Eric B | $72,500 | John Hasslinger |
Source: Public Records
Mortgage History
| Date | Status | Borrower | Loan Amount |
|---|---|---|---|
| Open | Lent Robert | $68,000 |
Source: Public Records
Tax History
| Year | Tax Paid | Tax Assessment Tax Assessment Total Assessment is a certain percentage of the fair market value that is determined by local assessors to be the total taxable value of land and additions on the property. | Land | Improvement |
|---|---|---|---|---|
| 2025 | $3,491 | $63,500 | $5,800 | $57,700 |
| 2024 | $3,491 | $63,500 | $5,800 | $57,700 |
| 2023 | $1,845 | $63,500 | $5,800 | $57,700 |
| 2022 | $1,863 | $63,500 | $5,800 | $57,700 |
| 2021 | $2,495 | $63,500 | $5,800 | $57,700 |
| 2020 | $275 | $63,500 | $5,800 | $57,700 |
| 2019 | $238 | $63,500 | $5,800 | $57,700 |
| 2018 | $513 | $63,500 | $5,800 | $57,700 |
| 2017 | $291 | $63,500 | $5,800 | $57,700 |
| 2016 | $284 | $63,500 | $5,800 | $57,700 |
| 2015 | -- | $63,500 | $5,800 | $57,700 |
| 2014 | -- | $63,500 | $5,800 | $57,700 |
Source: Public Records
Map
Nearby Homes
- 754 Garden Ave
- 802 Garden Ave
- 734 Bishop St
- 184 Grossman Ave
- 1013-1025 Brook St
- 1005 Billington St
- 611 Gulf St
- 735 E Highland Ave Unit 39
- 650 Queen St
- 1330 Brook St
- 401 Cherry St
- 935 Queen St
- 330 Laurel Ave
- VL Cherry St
- 109 Bradley Dr
- 309 Paragon Ave Unit 13
- 120 E Green St
- 2 Edwards Ct
- 118 E Green St
- 1 Edwards Ct
Your Personal Tour Guide
Ask me questions while you tour the home.