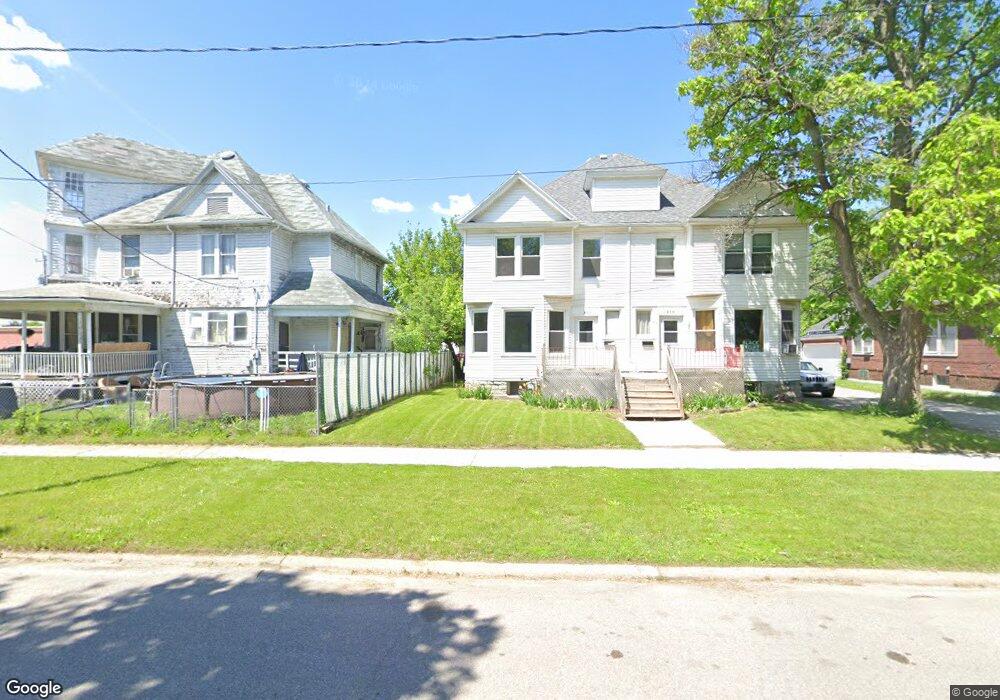
211 Clay St Unit 213 Waterloo, IA 50703
Walnut NeighborhoodEstimated Value: $81,000 - $125,000
--
Bed
2
Baths
2,704
Sq Ft
$38/Sq Ft
Est. Value
About This Home
This home is located at 211 Clay St Unit 213, Waterloo, IA 50703 and is currently estimated at $101,692, approximately $37 per square foot. 211 Clay St Unit 213 is a home located in Black Hawk County with nearby schools including Cunningham School, Central Middle School, and East High School.
Ownership History
Date
Name
Owned For
Owner Type
Purchase Details
Closed on
Nov 20, 2014
Sold by
Cv Properties Iii Llc
Bought by
May William W
Current Estimated Value
Home Financials for this Owner
Home Financials are based on the most recent Mortgage that was taken out on this home.
Original Mortgage
$41,250
Outstanding Balance
$31,494
Interest Rate
3.91%
Mortgage Type
New Conventional
Estimated Equity
$70,198
Purchase Details
Closed on
Mar 24, 2006
Sold by
Winters Vanessa and Henderson Hannah
Bought by
Investors Advantage Capital Fund I Llc
Home Financials for this Owner
Home Financials are based on the most recent Mortgage that was taken out on this home.
Original Mortgage
$51,840
Interest Rate
6.37%
Mortgage Type
Purchase Money Mortgage
Create a Home Valuation Report for This Property
The Home Valuation Report is an in-depth analysis detailing your home's value as well as a comparison with similar homes in the area
Home Values in the Area
Average Home Value in this Area
Purchase History
| Date | Buyer | Sale Price | Title Company |
|---|---|---|---|
| May William W | $55,000 | None Available | |
| Investors Advantage Capital Fund I Llc | $40,000 | Black Hawk County Abstract C |
Source: Public Records
Mortgage History
| Date | Status | Borrower | Loan Amount |
|---|---|---|---|
| Open | May William W | $41,250 | |
| Previous Owner | Investors Advantage Capital Fund I Llc | $51,840 |
Source: Public Records
Tax History Compared to Growth
Tax History
| Year | Tax Paid | Tax Assessment Tax Assessment Total Assessment is a certain percentage of the fair market value that is determined by local assessors to be the total taxable value of land and additions on the property. | Land | Improvement |
|---|---|---|---|---|
| 2025 | $1,454 | $91,940 | $4,570 | $87,370 |
| 2024 | $1,454 | $66,980 | $4,570 | $62,410 |
| 2023 | $1,324 | $66,980 | $4,570 | $62,410 |
| 2022 | $1,288 | $60,240 | $4,570 | $55,670 |
| 2021 | $1,208 | $60,240 | $4,570 | $55,670 |
| 2020 | $1,188 | $53,350 | $2,740 | $50,610 |
| 2019 | $1,188 | $53,350 | $2,740 | $50,610 |
| 2018 | $1,108 | $53,350 | $2,740 | $50,610 |
| 2017 | $1,142 | $49,730 | $2,740 | $46,990 |
| 2016 | $1,128 | $49,730 | $2,740 | $46,990 |
| 2015 | $1,128 | $49,730 | $2,740 | $46,990 |
| 2014 | $1,150 | $49,730 | $2,740 | $46,990 |
Source: Public Records
Map
Nearby Homes
- 337 Almond St
- 73 Lafayette St
- 607 Logan Ave
- 218 Sumner St
- 324 Sumner St
- 213-223 E 5th St
- 307 Center St
- 431 Wendell Ct
- 233 Quincy St
- 725 Lincoln St
- 911 Lafayette St Unit 913
- 0 Bates St
- 408-410 E 8th St
- 324 Bates St
- 630 Webster St
- 232 Webster St
- Lot 11 & 12 Webster St
- 320 Riehl St
- 212 Reed St
- 1002 Mobile St