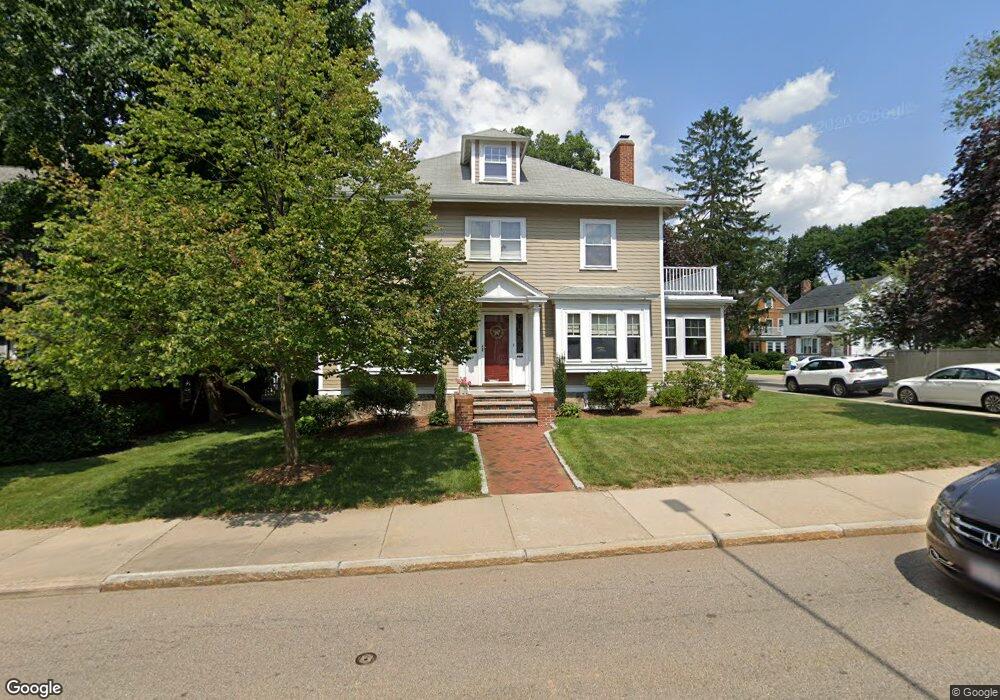
211 Corey St West Roxbury, MA 02132
West Roxbury NeighborhoodEstimated Value: $1,038,000 - $1,255,000
4
Beds
2
Baths
1,924
Sq Ft
$603/Sq Ft
Est. Value
About This Home
This home is located at 211 Corey St, West Roxbury, MA 02132 and is currently estimated at $1,159,300, approximately $602 per square foot. 211 Corey St is a home located in Suffolk County with nearby schools including Brooke Charter School Roslindale, Academy of the Pacific Rim Charter Public School, and Boston Preparatory Charter Public School.
Ownership History
Date
Name
Owned For
Owner Type
Purchase Details
Closed on
Jan 4, 2024
Sold by
Bent John J and Bent Donna D
Bought by
Bent Lt and Bent
Current Estimated Value
Purchase Details
Closed on
Jul 2, 1998
Sold by
Schreiber Mary
Bought by
Bent John H and Bent Donna D
Home Financials for this Owner
Home Financials are based on the most recent Mortgage that was taken out on this home.
Original Mortgage
$208,000
Interest Rate
7.04%
Mortgage Type
Purchase Money Mortgage
Create a Home Valuation Report for This Property
The Home Valuation Report is an in-depth analysis detailing your home's value as well as a comparison with similar homes in the area
Home Values in the Area
Average Home Value in this Area
Purchase History
| Date | Buyer | Sale Price | Title Company |
|---|---|---|---|
| Bent Lt | -- | None Available | |
| Bent John H | $260,000 | -- |
Source: Public Records
Mortgage History
| Date | Status | Borrower | Loan Amount |
|---|---|---|---|
| Previous Owner | Bent John H | $208,000 |
Source: Public Records
Tax History Compared to Growth
Tax History
| Year | Tax Paid | Tax Assessment Tax Assessment Total Assessment is a certain percentage of the fair market value that is determined by local assessors to be the total taxable value of land and additions on the property. | Land | Improvement |
|---|---|---|---|---|
| 2025 | $12,264 | $1,059,100 | $428,800 | $630,300 |
| 2024 | $10,541 | $967,100 | $377,800 | $589,300 |
| 2023 | $9,797 | $912,200 | $356,400 | $555,800 |
| 2022 | $9,022 | $829,200 | $324,000 | $505,200 |
| 2021 | $8,332 | $780,900 | $311,500 | $469,400 |
| 2020 | $7,706 | $729,700 | $288,000 | $441,700 |
| 2019 | $7,178 | $681,000 | $248,400 | $432,600 |
| 2018 | $6,863 | $654,900 | $248,400 | $406,500 |
| 2017 | $6,865 | $648,300 | $248,400 | $399,900 |
| 2016 | $6,584 | $598,500 | $248,400 | $350,100 |
| 2015 | $6,595 | $544,600 | $219,100 | $325,500 |
| 2014 | $6,462 | $513,700 | $219,100 | $294,600 |
Source: Public Records
Map
Nearby Homes
- 37 Pomfret St
- 19 Pomfret St
- 168 Maple St
- 76 Vermont St
- 37 Hastings St Unit 103
- 701 Vfw Pkwy
- 55 Redlands Rd
- 1789 Centre St Unit 202
- 76 Potomac St
- 539 Lagrange St
- 110 Park St Unit 3
- 9 Carroll St
- 22 Bellevue St
- 10 Burwell Rd
- 331 Vermont St
- 845 Lagrange St Unit 4
- 416 Belgrade Ave Unit 25
- 183 Temple St
- 865 Lagrange St Unit 5
- 425 Lagrange St Unit 203