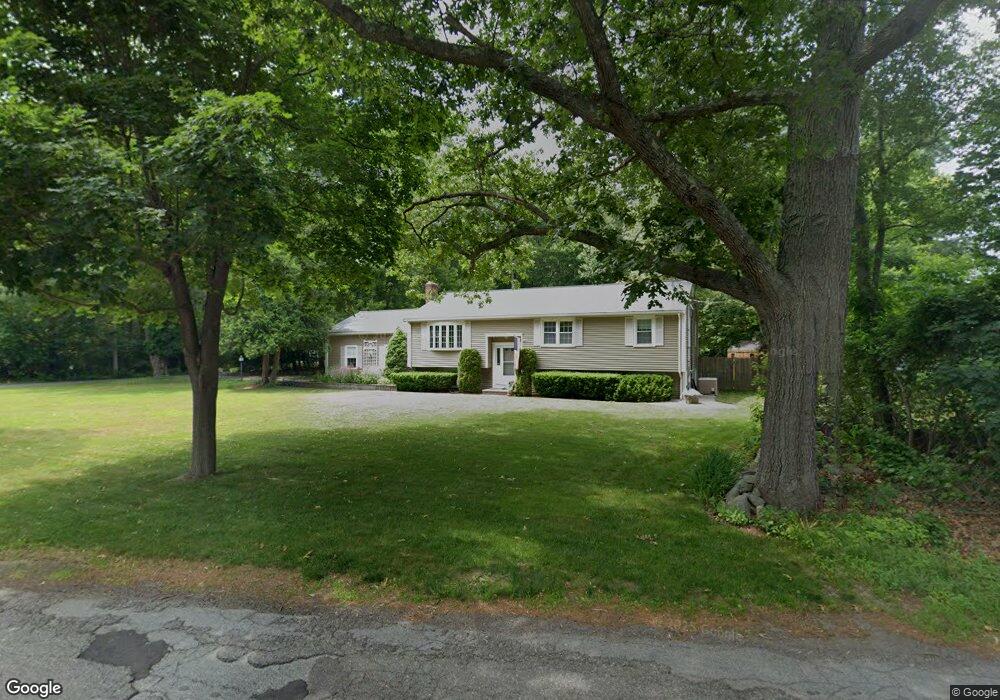
211 Cross St Bridgewater, MA 02324
Estimated Value: $540,000 - $630,000
3
Beds
3
Baths
1,234
Sq Ft
$477/Sq Ft
Est. Value
About This Home
This home is located at 211 Cross St, Bridgewater, MA 02324 and is currently estimated at $588,454, approximately $476 per square foot. 211 Cross St is a home located in Plymouth County with nearby schools including Mitchell Elementary School, Williams Intermediate School, and Bridgewater Middle School.
Ownership History
Date
Name
Owned For
Owner Type
Purchase Details
Closed on
Aug 22, 2023
Sold by
Laflamme Stephen M
Bought by
Laflamme Ft and Laflamme
Current Estimated Value
Purchase Details
Closed on
May 17, 2005
Sold by
Laflamme Stephen M
Bought by
Laflamme Ft and Laflamme
Purchase Details
Closed on
Apr 11, 1989
Sold by
Sprague John E
Bought by
Laflamme Stephen M
Home Financials for this Owner
Home Financials are based on the most recent Mortgage that was taken out on this home.
Original Mortgage
$127,900
Interest Rate
10.71%
Mortgage Type
Purchase Money Mortgage
Create a Home Valuation Report for This Property
The Home Valuation Report is an in-depth analysis detailing your home's value as well as a comparison with similar homes in the area
Home Values in the Area
Average Home Value in this Area
Purchase History
| Date | Buyer | Sale Price | Title Company |
|---|---|---|---|
| Laflamme Ft | -- | None Available | |
| Laflamme Ft | -- | -- | |
| Laflamme Stephen M | $159,900 | -- |
Source: Public Records
Mortgage History
| Date | Status | Borrower | Loan Amount |
|---|---|---|---|
| Previous Owner | Laflamme Stephen M | $127,900 |
Source: Public Records
Tax History
| Year | Tax Paid | Tax Assessment Tax Assessment Total Assessment is a certain percentage of the fair market value that is determined by local assessors to be the total taxable value of land and additions on the property. | Land | Improvement |
|---|---|---|---|---|
| 2025 | $6,426 | $543,200 | $185,800 | $357,400 |
| 2024 | $6,191 | $510,000 | $176,900 | $333,100 |
| 2023 | $5,994 | $466,800 | $165,300 | $301,500 |
| 2022 | $5,923 | $413,600 | $145,100 | $268,500 |
| 2021 | $5,216 | $360,200 | $129,500 | $230,700 |
| 2020 | $5,107 | $346,700 | $124,500 | $222,200 |
| 2019 | $5,032 | $339,300 | $124,500 | $214,800 |
| 2018 | $4,815 | $317,000 | $114,900 | $202,100 |
| 2017 | $4,619 | $295,900 | $114,900 | $181,000 |
| 2016 | $4,423 | $284,600 | $112,700 | $171,900 |
| 2015 | $4,417 | $272,000 | $109,300 | $162,700 |
| 2014 | $4,204 | $258,700 | $100,500 | $158,200 |
Source: Public Records
Map
Nearby Homes
- 256 Cross St
- 65 Ashtead Rd
- 35 Stockbridge Rd
- 5 Jaclyn Way
- 1 Jennifer Cir
- 260 Boxwood Ln
- 3 Jennifer Cir
- 68 Beech St
- 1 Anacki Ln Unit 1
- 162 Bayberry Rd
- 8 North St
- 678 Pine St
- 698 Pine St
- 1359 Old Pleasant St
- 35 Spruce St
- 30 Spruce St
- 000 Old Pleasant St
- 51 Cottage St
- 220 Bedford St Unit E-6
- 220 Bedford St Unit 32
Your Personal Tour Guide
Ask me questions while you tour the home.