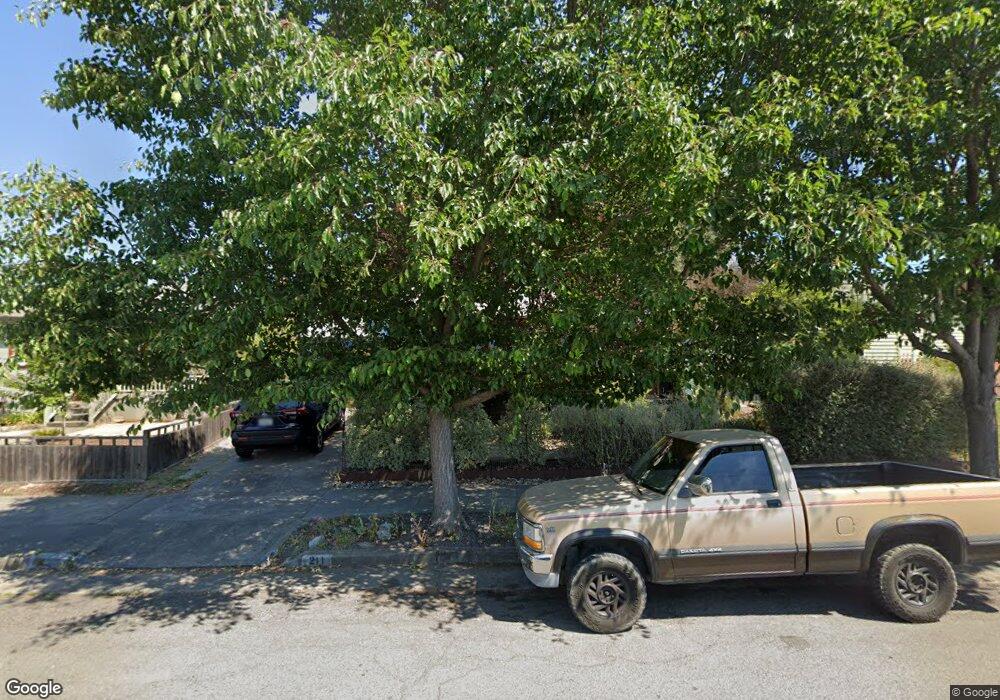
211 Douglas St Petaluma, CA 94952
Western Petaluma NeighborhoodEstimated Value: $607,000 - $893,000
2
Beds
1
Bath
748
Sq Ft
$1,029/Sq Ft
Est. Value
About This Home
This home is located at 211 Douglas St, Petaluma, CA 94952 and is currently estimated at $769,615, approximately $1,028 per square foot. 211 Douglas St is a home located in Sonoma County with nearby schools including McNear Elementary School, Petaluma Junior High School, and Petaluma High School.
Ownership History
Date
Name
Owned For
Owner Type
Purchase Details
Closed on
Jan 26, 2012
Sold by
Montgomery Karen and Montgomery Karen L
Bought by
Montgomery Karen
Current Estimated Value
Home Financials for this Owner
Home Financials are based on the most recent Mortgage that was taken out on this home.
Original Mortgage
$228,000
Outstanding Balance
$155,904
Interest Rate
3.85%
Mortgage Type
New Conventional
Estimated Equity
$613,711
Purchase Details
Closed on
Dec 31, 2001
Sold by
Sterling Elizabeth Anne and Schaefer Raymond William
Bought by
Montgomery Karen L
Home Financials for this Owner
Home Financials are based on the most recent Mortgage that was taken out on this home.
Original Mortgage
$325,000
Interest Rate
6.73%
Mortgage Type
Stand Alone First
Purchase Details
Closed on
Jul 27, 1998
Sold by
Smith Richard T and Smith Susan G
Bought by
Sterling Elizabeth Anne and Schaefer Raymond William
Home Financials for this Owner
Home Financials are based on the most recent Mortgage that was taken out on this home.
Original Mortgage
$172,000
Interest Rate
6.9%
Create a Home Valuation Report for This Property
The Home Valuation Report is an in-depth analysis detailing your home's value as well as a comparison with similar homes in the area
Home Values in the Area
Average Home Value in this Area
Purchase History
| Date | Buyer | Sale Price | Title Company |
|---|---|---|---|
| Montgomery Karen | -- | North American Title | |
| Montgomery Karen L | $325,000 | First American Title Co | |
| Sterling Elizabeth Anne | $215,000 | North American Title Co |
Source: Public Records
Mortgage History
| Date | Status | Borrower | Loan Amount |
|---|---|---|---|
| Open | Montgomery Karen | $228,000 | |
| Closed | Montgomery Karen L | $325,000 | |
| Previous Owner | Sterling Elizabeth Anne | $172,000 |
Source: Public Records
Tax History
| Year | Tax Paid | Tax Assessment Tax Assessment Total Assessment is a certain percentage of the fair market value that is determined by local assessors to be the total taxable value of land and additions on the property. | Land | Improvement |
|---|---|---|---|---|
| 2025 | $5,204 | $480,114 | $369,325 | $110,789 |
| 2024 | $5,204 | $470,701 | $362,084 | $108,617 |
| 2023 | $5,204 | $461,473 | $354,985 | $106,488 |
| 2022 | $5,011 | $452,425 | $348,025 | $104,400 |
| 2021 | $4,916 | $443,554 | $341,201 | $102,353 |
| 2020 | $4,957 | $439,007 | $337,703 | $101,304 |
| 2019 | $4,895 | $430,400 | $331,082 | $99,318 |
| 2018 | $4,875 | $421,962 | $324,591 | $97,371 |
| 2017 | $4,773 | $413,689 | $318,227 | $95,462 |
| 2016 | $4,657 | $405,579 | $311,988 | $93,591 |
| 2015 | $4,592 | $399,488 | $307,302 | $92,186 |
| 2014 | $4,568 | $391,664 | $301,283 | $90,381 |
Source: Public Records
Map
Nearby Homes
Your Personal Tour Guide
Ask me questions while you tour the home.