NOT LISTED FOR SALE
0.17 Acre
-- Price per Acre
7,501 Sq Ft Lot

Last Sold April 01, 2019

Last sale price $3,900,000

529 Days on Market

Highlights

  • 50 Feet of Waterfront
  • Pond View
  • Heating Available
  • Home fronts a pond
  • No HOA
  • 3-minute walk to Prospect Lake Park

About This Lot

As of April 2019

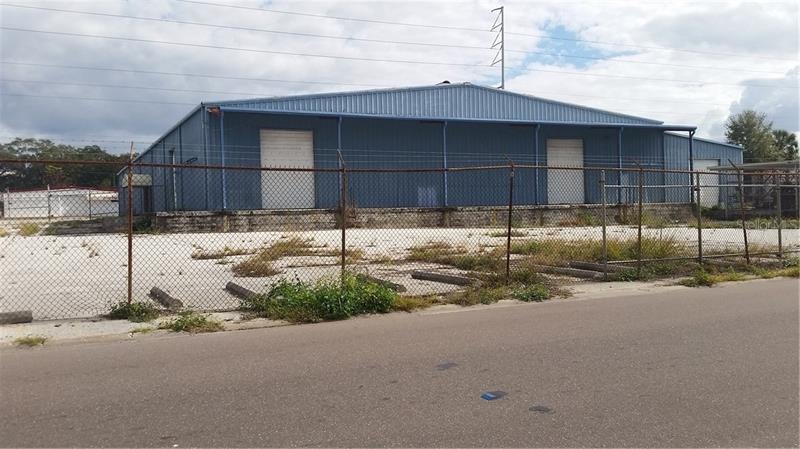
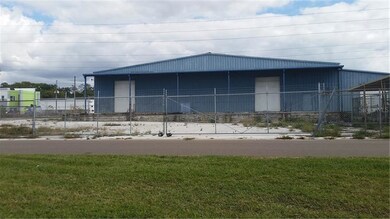
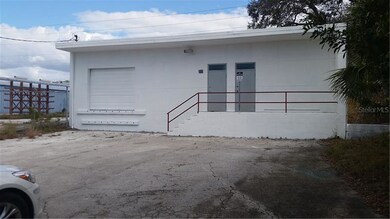
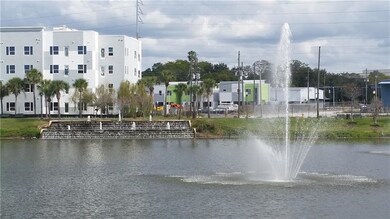
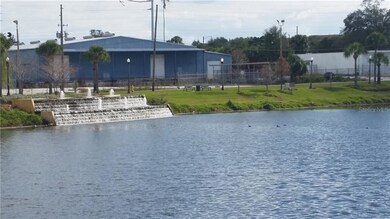
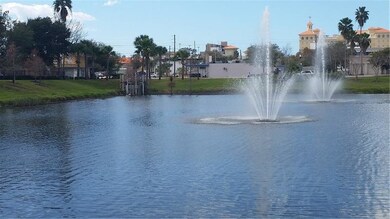
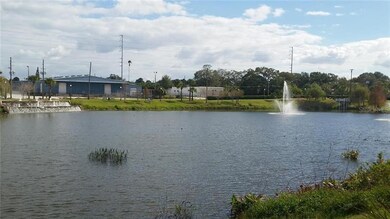
One of the biggest sites available for redevelopment in downtown Clearwater district, settled between Cleveland St , New Nolan development community and The Marriott Residence Hotel. Current density is at 30 units per acre. Additional may be pulled from density pool depending on project. Best Price per unit available currently is the area. Property is sold together with 951 Pierce St as a one package.

Last Agent to Sell the Property

Daphna Fischler

GALLERY PROPERTIES INTERNATIONAL License #3320146 Listed on: 10/16/2017

Last Buyer's Agent

Daphna Fischler

GALLERY PROPERTIES INTERNATIONAL License #3320146 Listed on: 10/16/2017

Property Details

Property Type

  • Land

Est. Annual Taxes

  • $1,531

Lot Details

  • 7,501 Sq Ft Lot
  • Lot Dimensions are 50x150x6
  • Home fronts a pond
  • 50 Feet of Waterfront

Additional Features

  • Pond Views
  • City Lot

Community Details

  • No Home Owners Association
  • Coachman Heights Rep Subdivision

Listing and Financial Details

  • Legal Lot and Block 11 / B
  • Assessor Parcel Number 15-29-15-16830-002-0110

Property Details

Property Type

Land

Est. Annual Taxes

$1,531

Lot Details

0

Listing Details

  • Property Type: Land
  • Lot Size Acres: 0.17
  • Lot Size Sq Ft: 7501
  • Status: Sold
  • Total Acreage: 0 to less than 1/4
  • Home Warranty Y N: No
  • Ratio: Close Price\List Price: 0.91765
  • Price per Sq Ft: 519.93
  • Close to Original List Price Ratio: 1.32203
  • View: Yes
  • Ownership: Fee Simple
  • Tax Year: 2017
  • Special Features: VirtualTour
  • Property Sub Type: LotsLands

Exterior Features

  • View: Water
  • Waterfront: Yes
  • Water View: Pond
  • Water View Y N: Yes
  • Front Footage: 50
  • Water Access Y N: No
  • Water Extras Y N: No
  • Flood Zone Panel: 12103C0108H
  • Waterfront Frontage: 50
  • Water Frontage Feet Pond: 50

Garage/Parking

  • Open Parking: No

Utilities

  • Utilities: Electricity Available, Street Lights
  • Water Source: Public
  • Cooling Y N: No
  • Heating Yn: Yes

Condo/Co-op/Association

  • Association: No
  • Association Fee Requirement: None

Lot Info

  • Parcel Number: 15-29-15-16830-002-0110
  • Additional Parcels: No
  • Current Use: Commercial
  • Lot Features: City Lot
  • Lot Dimensions: 50x150x6
  • Millage Rate: 20.72
  • Price Per Acre: 22941176
  • Flood Zone Code: X
  • Flood Zone Date: 2005-05-17
  • ResoLotSizeUnits: SquareFeet

Rental Info

  • For Lease Y N: No

Tax Info

  • Tax Annual Amount: 1531
  • Tax Block: B
  • Tax Book Number: 20-26
  • Tax Lot: 11

Multi Family

  • Waterfront Features: Pond

Ownership History

Date Name Owned For Owner Type

Purchase Details

Closed on
Feb 2, 2015
Sold by
Ewing Development Llp
Bought by
The Trustee Company

Purchase Details

Closed on
Sep 21, 2005
Sold by
Kehrer Joel J and Mckinley Frank L
Bought by
Ewing Development Llp

Home Financials for this Owner

Home Financials are based on the most recent Mortgage that was taken out on this home.
Original Mortgage
$552,500
Interest Rate
5.86%
Mortgage Type
Commercial
Source: Public Records

Range of Values:

--
Value Increase
--
Percent Increase
--
Adjusted for Inflation
Collateral Analytics

Collateral Analytics Collateral Analytics AVMs (Automated Valuation Model) employ a number of statistical approaches combined with neighborhood-specific comparable selection guarantees the most up-to-date and precise valuations.

Not Available

Collateral Analytics does not have data for the current month. Please view the chart for historical values.

ICE

ICE Mortgage Technology ICE Mortgage Technology’s AVM (Automated Valuation Model) is a state-of-the-art online residential property valuation tool that provides a quick and accurate estimate of the value of almost any home in the U.S.

Not Available

ICE Mortgage Technology does not have data for the current month. Please view the chart for historical values.

First American

First American First American Data & Analytics’ next-generation AVM combines unrivaled data assets with a blended ensemble of valuation models to produce highly accurate, reliable valuations you can trust.

Not Available

First American does not have data for the current month. Please view the chart for historical values.

Quantarium

Quantarium Quantarium’s valuation service, repeatedly proven the industry’s most accurate and comprehensive, is supercharged with a self-learning and auto-tuning AI engine that continually becomes smarter and more accurate as it processes daily inputs from the industry’s leading RE data lake.

Not Available

Quantarium does not have data for the current month. Please view the chart for historical values.

Average Value
Not Available
List Price
Sold Price
Create a Home Valuation Report for This Property
The Home Valuation Report is an in-depth analysis detailing your home's value as well as a comparison with similar homes in the area

Home Values in the Area

Source: Public Records

Average Home Value in this Area


Source: Public Records

Purchase History

Date Buyer Sale Price Title Company
The Trustee Company $425,000 Attorney
Ewing Development Llp $625,000 Stewart Title Of Pinellas In
Source: Public Records

Mortgage History

Date Status Borrower Loan Amount
Previous Owner Ewing Development Llp $552,500
Source: Public Records

Property History

Date Event Price List to Sale Price per Sq Ft
04/01/2019 04/01/19 Sold $3,900,000 -8.2% --
09/21/2018 09/21/18 Price Changed $4,250,000 +7.6% --
09/03/2018 09/03/18 Price Changed $3,950,000 +8.2% --
08/04/2018 08/04/18 Price Changed $3,650,000 +14.1% --
04/30/2018 04/30/18 Price Changed $3,200,000 +8.5% --
10/16/2017 10/16/17 For Sale $2,950,000 -- --
Source: Stellar MLS

Tax History Compared to Growth

Source: Public Records

Tax History

Year Tax Paid Tax Assessment Tax Assessment Total Assessment is a certain percentage of the fair market value that is determined by local assessors to be the total taxable value of land and additions on the property. Land Improvement
2024 $2,402 $136,570 $95,625 $40,945
2023 $2,402 $129,634 $89,250 $40,384
2022 $2,199 $118,211 $82,875 $35,336
2021 $2,102 $108,471 $0 $0
2020 $1,920 $96,077 $0 $0
2019 $1,735 $83,600 $47,831 $35,769
2018 $1,590 $76,000 $0 $0
2017 $1,531 $75,000 $0 $0
2016 $1,451 $70,000 $0 $0
2015 $1,588 $75,000 $0 $0
2014 $1,533 $72,100 $0 $0
Source: Public Records

Agents Affiliated with this Home

  • Section Image
See All Agents

Map

Source: Stellar MLS

MLS Number: U7835325

Stellar MLS

APN: 15-29-15-16830-002-0110