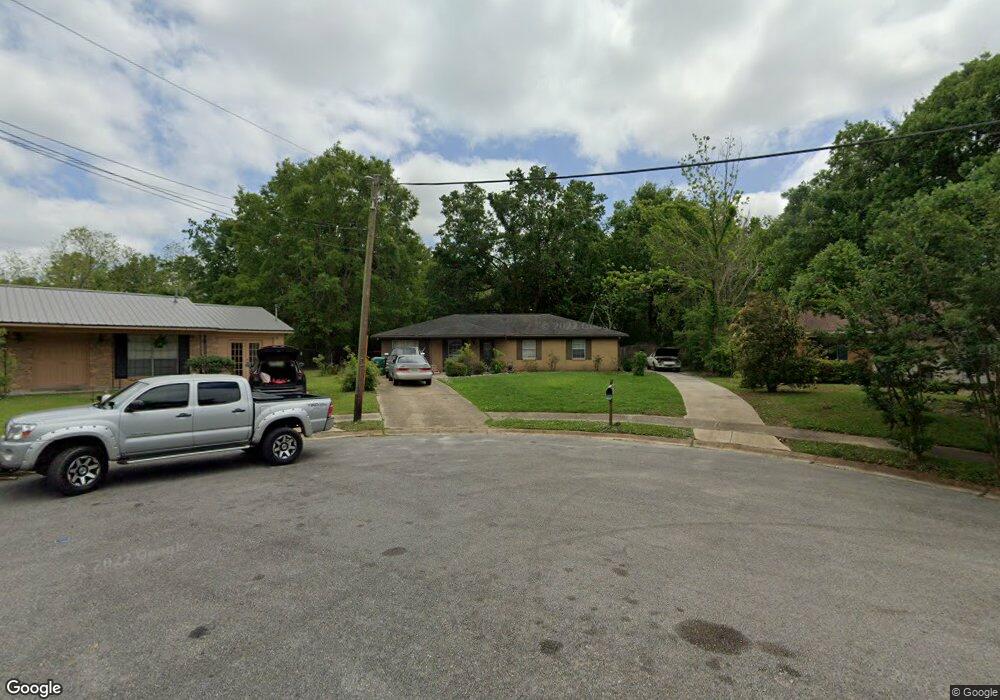
211 Gamble Ct Ocean Springs, MS 39564
Estimated Value: $216,762 - $292,000
Studio
2
Baths
1,368
Sq Ft
$185/Sq Ft
Est. Value
About This Home
This home is located at 211 Gamble Ct, Ocean Springs, MS 39564 and is currently estimated at $252,691, approximately $184 per square foot. 211 Gamble Ct is a home located in Jackson County with nearby schools including Oak Park Elementary School, Ocean Springs Middle School, and Ocean Springs High School.
Ownership History
Date
Name
Owned For
Owner Type
Purchase Details
Closed on
Jul 29, 2020
Sold by
Joiner Regina F and Lamont-Joiner Derek
Bought by
Joiner Malcolm W
Current Estimated Value
Home Financials for this Owner
Home Financials are based on the most recent Mortgage that was taken out on this home.
Original Mortgage
$84,000
Outstanding Balance
$57,915
Interest Rate
3%
Mortgage Type
New Conventional
Estimated Equity
$194,776
Purchase Details
Closed on
Mar 8, 2010
Sold by
Joiner John M
Bought by
Joiner Regina Faye and Joiner Malcolm Willlis
Create a Home Valuation Report for This Property
The Home Valuation Report is an in-depth analysis detailing your home's value as well as a comparison with similar homes in the area
Home Values in the Area
Average Home Value in this Area
Purchase History
| Date | Buyer | Sale Price | Title Company |
|---|---|---|---|
| Joiner Malcolm W | -- | None Available | |
| Joiner Regina Faye | -- | Murphy-Government Street Lan |
Source: Public Records
Mortgage History
| Date | Status | Borrower | Loan Amount |
|---|---|---|---|
| Open | Joiner Malcolm W | $84,000 |
Source: Public Records
Tax History
| Year | Tax Paid | Tax Assessment Tax Assessment Total Assessment is a certain percentage of the fair market value that is determined by local assessors to be the total taxable value of land and additions on the property. | Land | Improvement |
|---|---|---|---|---|
| 2025 | $1,312 | $10,427 | $1,983 | $8,444 |
| 2024 | $1,312 | $9,728 | $1,932 | $7,796 |
| 2023 | $1,102 | $14,498 | $2,898 | $11,600 |
| 2022 | $2,117 | $14,498 | $2,898 | $11,600 |
| 2021 | $2,102 | $14,600 | $0 | $0 |
| 2020 | $1,839 | $12,648 | $2,520 | $10,128 |
| 2019 | $1,832 | $12,648 | $2,520 | $10,128 |
| 2018 | $134 | $8,432 | $1,680 | $6,752 |
| 2017 | $134 | $8,432 | $1,680 | $6,752 |
| 2016 | $132 | $8,432 | $1,680 | $6,752 |
| 2015 | $48 | $78,320 | $16,800 | $61,520 |
| 2014 | $47 | $7,832 | $1,680 | $6,152 |
| 2013 | $46 | $7,832 | $1,680 | $6,152 |
Source: Public Records
Map
Nearby Homes
- 268 Mccool St
- 272 Holcomb Blvd
- 288 Mc Cool St
- 11 Fleetwood Place
- 113 Colmer Cir
- 2100 Lafitte St
- 110 Simon Blvd
- 296 Holcomb Blvd
- 417 Woody Cir
- 310 Holcomb Blvd Unit 323
- 310 Holcomb Blvd Unit 230
- 310 Holcomb Blvd Unit 305
- 310 Holcomb Blvd Unit 318
- 0 Simon Blvd Unit 4063829
- 103 Armand Oaks
- 219 Armand Oaks
- 229 Woodland Cir
- 2550 Davidson Rd
- 133 Seaside Dr
- 132 Pine Dr
Your Personal Tour Guide
Ask me questions while you tour the home.