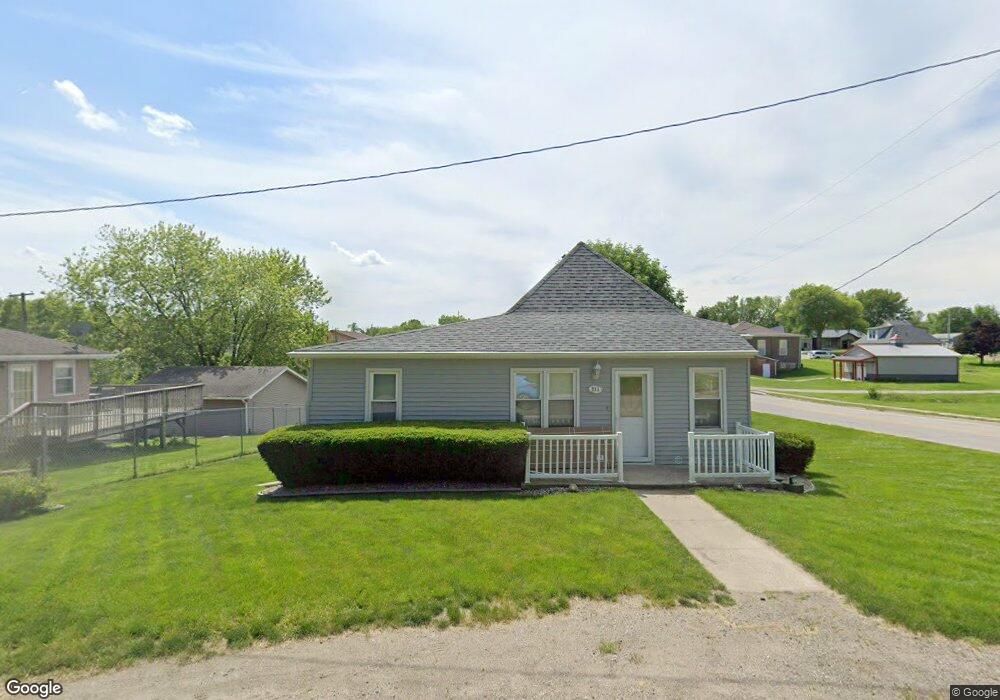
211 Garfield St Runnells, IA 50237
Estimated Value: $199,833 - $242,000
2
Beds
1
Bath
1,472
Sq Ft
$146/Sq Ft
Est. Value
About This Home
This home is located at 211 Garfield St, Runnells, IA 50237 and is currently estimated at $215,458, approximately $146 per square foot. 211 Garfield St is a home located in Polk County with nearby schools including Runnells Elementary School, Southeast Polk Spring Creek- 6th Grade, and Southeast Polk Junior High School.
Create a Home Valuation Report for This Property
The Home Valuation Report is an in-depth analysis detailing your home's value as well as a comparison with similar homes in the area
Home Values in the Area
Average Home Value in this Area
Tax History Compared to Growth
Tax History
| Year | Tax Paid | Tax Assessment Tax Assessment Total Assessment is a certain percentage of the fair market value that is determined by local assessors to be the total taxable value of land and additions on the property. | Land | Improvement |
|---|---|---|---|---|
| 2025 | $2,654 | $190,400 | $32,900 | $157,500 |
| 2024 | $2,654 | $169,000 | $29,000 | $140,000 |
| 2023 | $2,574 | $169,000 | $29,000 | $140,000 |
| 2022 | $2,540 | $137,500 | $25,100 | $112,400 |
| 2021 | $2,364 | $137,500 | $25,100 | $112,400 |
| 2020 | $2,322 | $122,800 | $22,500 | $100,300 |
| 2019 | $2,200 | $122,800 | $22,500 | $100,300 |
| 2018 | $2,202 | $108,900 | $19,700 | $89,200 |
| 2017 | $2,254 | $108,900 | $19,700 | $89,200 |
| 2016 | $2,240 | $100,500 | $18,100 | $82,400 |
| 2015 | $2,240 | $100,500 | $18,100 | $82,400 |
| 2014 | $2,158 | $97,700 | $17,400 | $80,300 |
Source: Public Records
Map
Nearby Homes
- 203 Brown St
- 12028 SE 64th Ave
- 6121 SE 104th St
- 3333 220th Ave
- 3320 SE 96th St
- 3380 SE 96th St
- 2493 SE 108th St
- 0 S 128th Ave W
- 235 N Washington St
- 00 Highway 5
- Highway 5
- 24479 Elthon Place
- 7930 SE Vandalia Dr
- 7820 SE Vandalia Dr
- 3350 SE 82nd St
- 2496 SE 83rd Ct
- 3356 SE 82nd St
- 2511 SE 82nd St
- 6335 S31 Hwy
- 18670 Delaware Place
- 104 Garfield St
- 106 Garfield St
- 108 E Mckinney St
- 108 E Mckinney St
- 0 Tbd St Unit 547279
- District/Parcel 22000136003001 Land
- T.B.D. Iowa 316
- TBD Iowa 316
- 105 Garfield St
- 204 E Hancock St
- 202 E Mckinney St
- 101 & 103 Brown St
- 101 & 102 Brown St
- 101 Brown St
- 103 E Park Ave
- 105 E Park Ave
- 203 E Mckinney St
- 205 E Mckinney St
- 207 Brown St
- 200 Brown St