Estimated Value: $350,000 - $500,000
3
Beds
4
Baths
3,174
Sq Ft
$136/Sq Ft
Est. Value
About This Home
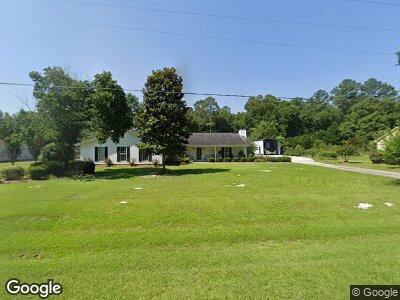
This home is located at 211 Habersham Ln, Perry, GA 31069 and is currently estimated at $430,334, approximately $135 per square foot. 211 Habersham Ln is a home located in Houston County with nearby schools including Kings Chapel Elementary School, Perry Middle School, and Perry High School.
Ownership History
Date
Name
Owned For
Owner Type
Purchase Details
Closed on
Feb 15, 2019
Sold by
Mattingly Mark A
Bought by
Mattingly Mark A and Mattingly Teresa F
Current Estimated Value
Home Financials for this Owner
Home Financials are based on the most recent Mortgage that was taken out on this home.
Original Mortgage
$189,500
Outstanding Balance
$169,916
Interest Rate
4.4%
Mortgage Type
New Conventional
Purchase Details
Closed on
Aug 22, 1997
Sold by
Thurman Edwin A
Bought by
Mattingly Mark A
Purchase Details
Closed on
Jan 16, 1991
Sold by
Baggett James E and Alice D*
Bought by
Thurman Edwin A and Mary Alice*
Purchase Details
Closed on
May 26, 1987
Sold by
Gains John D and Daphanie S*
Bought by
Baggett James E and Alice D*
Purchase Details
Closed on
Apr 24, 1984
Sold by
Meeks Lewis Etal
Bought by
Gains John D and Daphanie S*
Create a Home Valuation Report for This Property
The Home Valuation Report is an in-depth analysis detailing your home's value as well as a comparison with similar homes in the area
Home Values in the Area
Average Home Value in this Area
Purchase History
| Date | Buyer | Sale Price | Title Company |
|---|---|---|---|
| Mattingly Mark A | -- | None Available | |
| Mattingly Mark A | $94,000 | -- | |
| Thurman Edwin A | -- | -- | |
| Thurman Edwin A | $77,700 | -- | |
| Baggett James E | $68,000 | -- | |
| Gains John D | $7,200 | -- |
Source: Public Records
Mortgage History
| Date | Status | Borrower | Loan Amount |
|---|---|---|---|
| Open | Mattingly Mark A | $189,500 | |
| Closed | Mattingly Mark A | $189,500 | |
| Closed | Mattingly Mark A | $174,000 | |
| Closed | Mattingly Mark A | $89,005 | |
| Closed | Mattingly Mark A | $36,500 | |
| Closed | Mattingly Mark A | $135,500 | |
| Closed | Mattingly Mark A | $57,000 |
Source: Public Records
Tax History Compared to Growth
Tax History
| Year | Tax Paid | Tax Assessment Tax Assessment Total Assessment is a certain percentage of the fair market value that is determined by local assessors to be the total taxable value of land and additions on the property. | Land | Improvement |
|---|---|---|---|---|
| 2024 | $3,421 | $145,000 | $10,000 | $135,000 |
| 2023 | $2,893 | $121,680 | $10,000 | $111,680 |
| 2022 | $2,723 | $114,640 | $10,000 | $104,640 |
| 2021 | $2,596 | $108,840 | $10,000 | $98,840 |
| 2020 | $2,474 | $103,360 | $10,000 | $93,360 |
| 2019 | $1,583 | $66,840 | $10,000 | $56,840 |
| 2018 | $1,583 | $66,840 | $10,000 | $56,840 |
| 2017 | $1,584 | $66,840 | $10,000 | $56,840 |
| 2016 | $1,587 | $66,840 | $10,000 | $56,840 |
| 2015 | $1,590 | $66,840 | $10,000 | $56,840 |
| 2014 | -- | $66,840 | $10,000 | $56,840 |
| 2013 | -- | $66,840 | $10,000 | $56,840 |
Source: Public Records
Map
Nearby Homes
- 201 Habersham Ln
- 108 Barrister Trail
- 110 Barrister Trail
- 112 Barrister Trail
- 114 Barrister Trail
- 106 Plantation Place
- 101 Pridgen Pass
- 115 Pridgen Pass
- 109 Milford Cir
- 108 Pridgen Pass
- 123 Pridgen Pass
- 110 Golden Ingot Ct
- 0 Pridgen Pass Unit 10466225
- 0 Pridgen Pass Unit 251104
- 112 Golden Ingot Cr
- 122 Milford Cir
- 200 Worchester Cir
- 211 Habersham Ln
- 209 Habersham Ln
- 105 Wimbish Way
- 213 Habersham Ln
- 107 Wimbish E
- 103 Wimbish Way
- 207 Habersham Ln
- 215 Habersham Ln
- 107 Wimbish Way
- 212 Habersham Ln
- 105 Wimbish E
- 210 Habersham Ln
- 214 Habersham Ln
- 103 Wimbish E
- 208 Habersham Ln
- 216 Habersham Ln
- 217 Habersham Ln
- 0 Habersham Ln Unit 3190905
- 0 Habersham Ln Unit 8245989
- 0 Habersham Ln