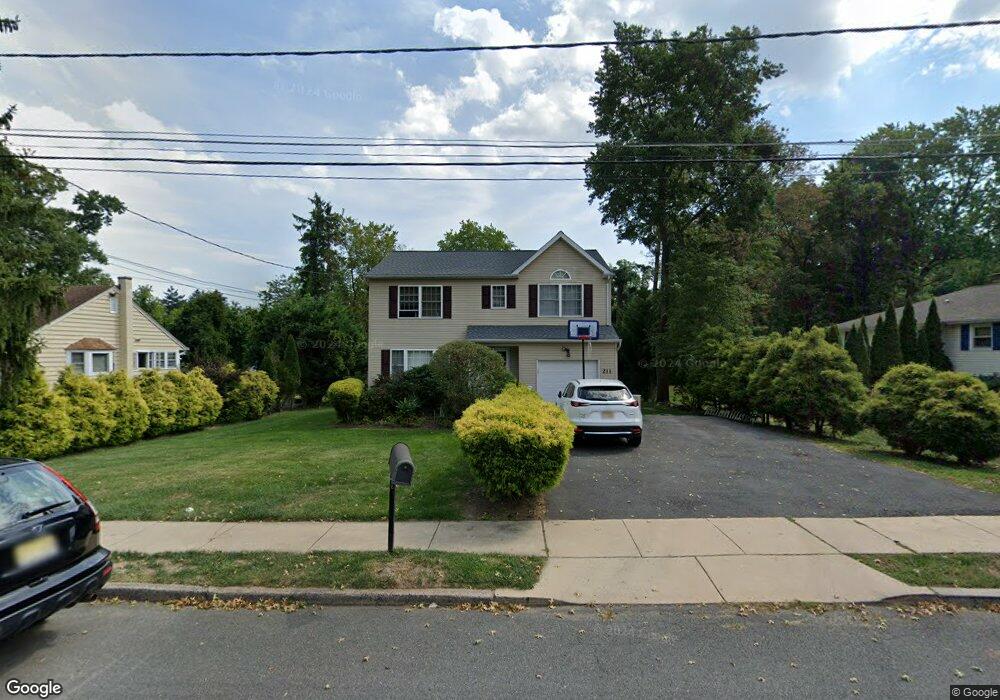
211 Inland Ave Ewing, NJ 08638
Braeburn Heights NeighborhoodEstimated Value: $439,000 - $485,000
--
Bed
--
Bath
1,683
Sq Ft
$275/Sq Ft
Est. Value
About This Home
This home is located at 211 Inland Ave, Ewing, NJ 08638 and is currently estimated at $462,565, approximately $274 per square foot. 211 Inland Ave is a home located in Mercer County with nearby schools including Ewing High School, Paul Robeson Charter School For The Humanities, and Trenton Stem-To-Civics Charter School.
Ownership History
Date
Name
Owned For
Owner Type
Purchase Details
Closed on
Jan 27, 2006
Sold by
Campbell Builders Inc
Bought by
Stephenson Dwayne and Stephenson Ann Marie
Current Estimated Value
Home Financials for this Owner
Home Financials are based on the most recent Mortgage that was taken out on this home.
Original Mortgage
$275,577
Outstanding Balance
$155,415
Interest Rate
6.23%
Estimated Equity
$307,150
Purchase Details
Closed on
Aug 16, 2005
Sold by
Chnerr Dennis
Bought by
Campbell Builders Inc
Create a Home Valuation Report for This Property
The Home Valuation Report is an in-depth analysis detailing your home's value as well as a comparison with similar homes in the area
Home Values in the Area
Average Home Value in this Area
Purchase History
| Date | Buyer | Sale Price | Title Company |
|---|---|---|---|
| Stephenson Dwayne | $284,100 | -- | |
| Campbell Builders Inc | $70,100 | -- |
Source: Public Records
Mortgage History
| Date | Status | Borrower | Loan Amount |
|---|---|---|---|
| Open | Stephenson Dwayne | $275,577 |
Source: Public Records
Tax History Compared to Growth
Tax History
| Year | Tax Paid | Tax Assessment Tax Assessment Total Assessment is a certain percentage of the fair market value that is determined by local assessors to be the total taxable value of land and additions on the property. | Land | Improvement |
|---|---|---|---|---|
| 2025 | $8,621 | $219,200 | $56,400 | $162,800 |
| 2024 | $8,104 | $219,200 | $56,400 | $162,800 |
| 2023 | $8,104 | $219,200 | $56,400 | $162,800 |
| 2022 | $7,885 | $219,200 | $56,400 | $162,800 |
| 2021 | $7,692 | $219,200 | $56,400 | $162,800 |
| 2020 | $7,582 | $219,200 | $56,400 | $162,800 |
| 2019 | $7,385 | $219,200 | $56,400 | $162,800 |
| 2018 | $7,564 | $143,200 | $40,400 | $102,800 |
| 2017 | $7,740 | $143,200 | $40,400 | $102,800 |
| 2016 | $7,635 | $143,200 | $40,400 | $102,800 |
| 2015 | $7,534 | $143,200 | $40,400 | $102,800 |
| 2014 | $7,514 | $143,200 | $40,400 | $102,800 |
Source: Public Records
Map
Nearby Homes
- 200 Claflin Ave
- 188 Browning Ave
- 200 Upland Ave
- 186 Upland Ave
- 140 Crescent Ave
- 117 Browning Ave
- 28 Brattle Ave
- 120 Sussex St
- 194 Woodland Ave
- 121 Oregon Ave
- 9 Blossom Dr
- 38 Running Brook Rd
- 4 Blossom Dr
- 10 Blossom Dr
- 111 Louisiana Ave
- 137 Ardsley Ave
- 107 Hawthorne Ave
- 41 Poland St
- 14 Chesney Ave
- 9 Auburn Ave