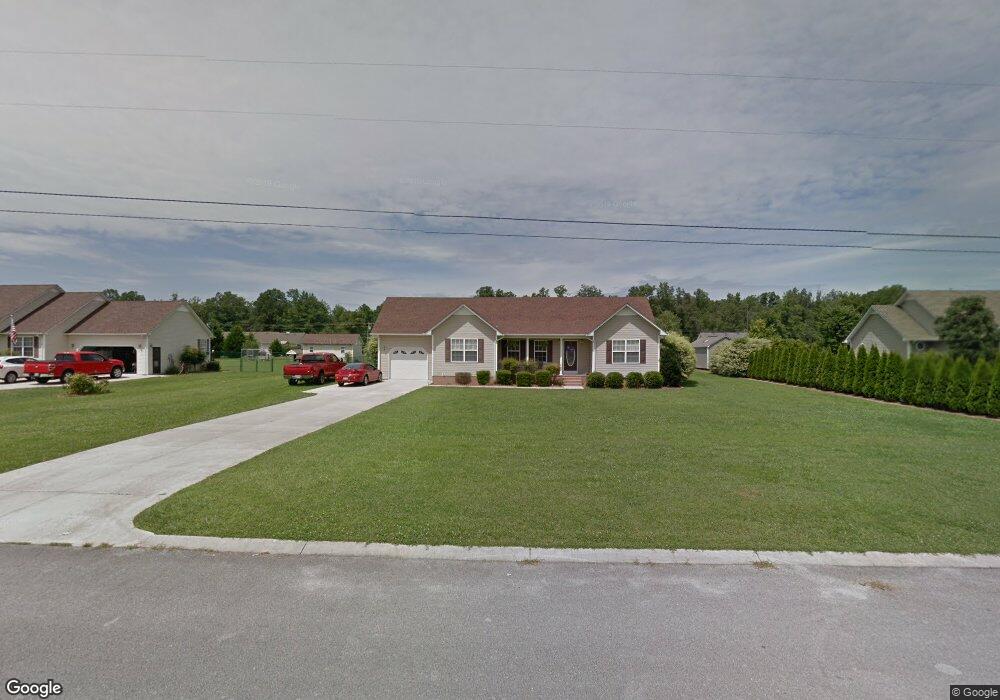
211 Jacoby Dr Manchester, TN 37355
Estimated Value: $245,000 - $313,000
--
Bed
2
Baths
1,330
Sq Ft
$213/Sq Ft
Est. Value
About This Home
This home is located at 211 Jacoby Dr, Manchester, TN 37355 and is currently estimated at $283,678, approximately $213 per square foot. 211 Jacoby Dr is a home located in Coffee County with nearby schools including Deerfield Elementary School, Coffee County Middle School, and Coffee County Central High School.
Ownership History
Date
Name
Owned For
Owner Type
Purchase Details
Closed on
Aug 23, 2013
Sold by
Vaughn Joshua L
Bought by
Ferrell Ryan and Ferrell Tabitha
Current Estimated Value
Home Financials for this Owner
Home Financials are based on the most recent Mortgage that was taken out on this home.
Original Mortgage
$108,007
Outstanding Balance
$81,053
Interest Rate
4.62%
Mortgage Type
FHA
Estimated Equity
$202,625
Purchase Details
Closed on
Apr 29, 2011
Sold by
Jacobs Heath
Bought by
Vaughn Joshua L
Home Financials for this Owner
Home Financials are based on the most recent Mortgage that was taken out on this home.
Original Mortgage
$113,989
Interest Rate
4.83%
Mortgage Type
Commercial
Purchase Details
Closed on
May 23, 2003
Sold by
Freeze Ronnie and Freeze Dorothy
Bought by
Jacobs Heath
Home Financials for this Owner
Home Financials are based on the most recent Mortgage that was taken out on this home.
Original Mortgage
$88,600
Interest Rate
5.79%
Create a Home Valuation Report for This Property
The Home Valuation Report is an in-depth analysis detailing your home's value as well as a comparison with similar homes in the area
Home Values in the Area
Average Home Value in this Area
Purchase History
| Date | Buyer | Sale Price | Title Company |
|---|---|---|---|
| Ferrell Ryan | $110,000 | -- | |
| Vaughn Joshua L | $110,000 | -- | |
| Jacobs Heath | $88,600 | -- |
Source: Public Records
Mortgage History
| Date | Status | Borrower | Loan Amount |
|---|---|---|---|
| Open | Ferrell Ryan | $108,007 | |
| Previous Owner | Vaughn Joshua L | $113,989 | |
| Previous Owner | Jacobs Heath | $88,600 |
Source: Public Records
Tax History Compared to Growth
Tax History
| Year | Tax Paid | Tax Assessment Tax Assessment Total Assessment is a certain percentage of the fair market value that is determined by local assessors to be the total taxable value of land and additions on the property. | Land | Improvement |
|---|---|---|---|---|
| 2024 | $1,062 | $45,550 | $5,000 | $40,550 |
| 2023 | $1,062 | $45,550 | $0 | $0 |
| 2022 | $1,062 | $45,550 | $5,000 | $40,550 |
| 2021 | $1,022 | $34,850 | $3,750 | $31,100 |
| 2020 | $875 | $29,850 | $3,750 | $26,100 |
| 2019 | $875 | $29,850 | $3,750 | $26,100 |
| 2018 | $875 | $29,850 | $3,750 | $26,100 |
| 2017 | $881 | $27,000 | $3,750 | $23,250 |
| 2016 | $881 | $27,000 | $3,750 | $23,250 |
| 2015 | $881 | $27,000 | $3,750 | $23,250 |
| 2014 | $881 | $26,999 | $0 | $0 |
Source: Public Records
Map
Nearby Homes
- 233 Jacoby Dr
- 272 Jacoby Dr
- 124 Houston Bell Rd
- 6748 Woodbury Hwy
- 389 Houston Bell Rd
- 650 Parker Rd
- 0 Duncan Rd
- 315 New Union Heights
- 8141 Woodbury Hwy Unit 8141
- 89 Saddle St
- 220 Winton Way Rd
- 67 Eldon Dr
- 493 Maple Springs Rd
- 239 Executive Ct
- 250 Shelley Rd
- 106 Rigney Rd
- 621 Brandon Rd
- 481 Matts Hollow Rd
- 559 Geneva Boynton Rd
- 189 Strawberry Ridge