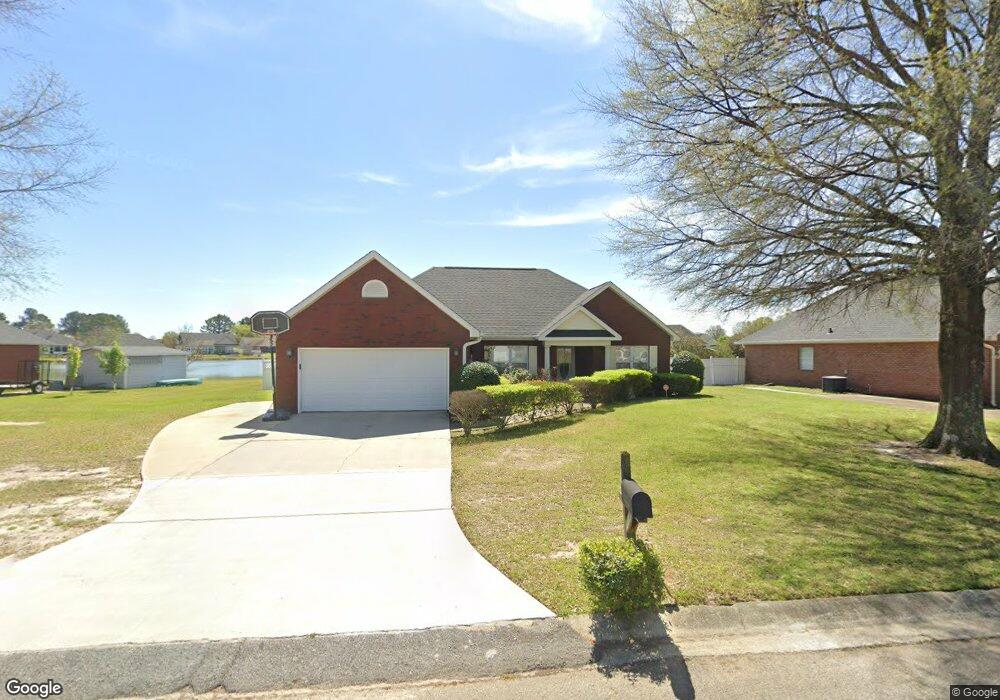
211 Knights Bridge Warner Robins, GA 31093
Estimated Value: $229,000 - $249,000
3
Beds
2
Baths
1,502
Sq Ft
$159/Sq Ft
Est. Value
About This Home
This home is located at 211 Knights Bridge, Warner Robins, GA 31093 and is currently estimated at $238,766, approximately $158 per square foot. 211 Knights Bridge is a home located in Houston County with nearby schools including Eagle Springs Elementary School, Thomson Middle School, and Northside High School.
Ownership History
Date
Name
Owned For
Owner Type
Purchase Details
Closed on
Jul 23, 2012
Sold by
Johnson Albert and Johnson Albert
Bought by
Johnson Albert
Current Estimated Value
Home Financials for this Owner
Home Financials are based on the most recent Mortgage that was taken out on this home.
Original Mortgage
$129,940
Outstanding Balance
$20,025
Interest Rate
3.72%
Mortgage Type
New Conventional
Estimated Equity
$218,741
Purchase Details
Closed on
Mar 15, 2005
Sold by
Reyna Richard K and Reyna Linda G
Bought by
Johnson Albert
Home Financials for this Owner
Home Financials are based on the most recent Mortgage that was taken out on this home.
Original Mortgage
$109,200
Interest Rate
6.89%
Mortgage Type
Adjustable Rate Mortgage/ARM
Purchase Details
Closed on
Dec 10, 2001
Sold by
Crosby Homes Inc
Bought by
Reyna Richard K and Reyna Linda G
Purchase Details
Closed on
Aug 29, 2001
Sold by
Chelsea Homes Inc
Bought by
Crosby Homes Inc
Create a Home Valuation Report for This Property
The Home Valuation Report is an in-depth analysis detailing your home's value as well as a comparison with similar homes in the area
Home Values in the Area
Average Home Value in this Area
Purchase History
| Date | Buyer | Sale Price | Title Company |
|---|---|---|---|
| Johnson Albert | -- | None Available | |
| Johnson Albert | $136,500 | None Available | |
| Reyna Richard K | $123,900 | -- | |
| Crosby Homes Inc | $19,000 | -- |
Source: Public Records
Mortgage History
| Date | Status | Borrower | Loan Amount |
|---|---|---|---|
| Open | Johnson Albert | $129,940 | |
| Closed | Johnson Albert | $109,200 | |
| Closed | Johnson Albert | $27,300 |
Source: Public Records
Tax History Compared to Growth
Tax History
| Year | Tax Paid | Tax Assessment Tax Assessment Total Assessment is a certain percentage of the fair market value that is determined by local assessors to be the total taxable value of land and additions on the property. | Land | Improvement |
|---|---|---|---|---|
| 2024 | -- | $77,800 | $9,600 | $68,200 |
| 2023 | $0 | $73,040 | $9,600 | $63,440 |
| 2022 | $2,279 | $69,120 | $9,600 | $59,520 |
| 2021 | $1,194 | $53,640 | $9,600 | $44,040 |
| 2020 | $1,104 | $49,520 | $8,400 | $41,120 |
| 2019 | $1,104 | $49,520 | $8,400 | $41,120 |
| 2018 | $1,104 | $49,520 | $8,400 | $41,120 |
| 2017 | $1,105 | $49,520 | $8,400 | $41,120 |
| 2016 | $1,107 | $49,520 | $8,400 | $41,120 |
| 2015 | -- | $49,520 | $8,400 | $41,120 |
| 2014 | $519 | $49,520 | $8,400 | $41,120 |
| 2013 | $519 | $48,680 | $8,400 | $40,280 |
Source: Public Records
Map
Nearby Homes
- 113 Park Ln
- 105 Park Ln
- 32 Willow Lake Dr
- 202 Fall Harvest
- 0 Gunn Rd Unit 10620588
- 236 Beau Claire Cir
- 238 Beau Claire Cir
- 240 Beau Claire Cir
- 302 Beau Claire Cir
- 312 Beau Claire Cir
- 310 Beau Claire Cir
- 106 Bretwood Ct
- 417 Covington Cove
- 109 Creek Bluff Trail
- 115 Montrose Ln
- 100 Montview Way
- 100 Coventry Manor Ct
- 801 Osigian Blvd
- 105 Rockford Ct
- 132 Montrose Ln
- 209 Knights Bridge
- 213 Knights Bridge Unit VI
- 207 Knights Bridge
- 215 Knights Bridge
- 216 Knights Bridge
- 220 Knights Bridge
- 205 Knights Bridge
- 214 Knights Bridge
- 222 Knights Bridge
- 217 Knights Bridge
- 212 Knights Bridge
- 109 Wetherby Ct
- 107 Wetherby Ct
- 224 Knights Bridge
- 203 Knights Bridge
- 203 Knights Bridge Unit 60
- 111 Wetherby Ct
- 219 Knights Bridge
- 105 Wetherby Ct
- 210 Knights Bridge