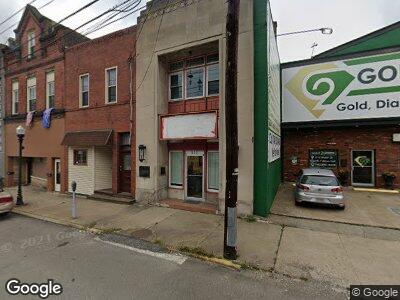
211 Main St Bridgeport, OH 43912
Estimated Value: $89,245
--
Bed
--
Bath
1,620
Sq Ft
$55/Sq Ft
Est. Value
About This Home
This home is located at 211 Main St, Bridgeport, OH 43912 and is currently estimated at $89,245, approximately $55 per square foot. 211 Main St is a home located in Belmont County with nearby schools including Bridgeport Elementary School, Bridgeport Middle School, and Bridgeport High School.
Ownership History
Date
Name
Owned For
Owner Type
Purchase Details
Closed on
Mar 18, 2021
Sold by
Bell Katrina L
Bought by
Kovacs Jason M
Current Estimated Value
Home Financials for this Owner
Home Financials are based on the most recent Mortgage that was taken out on this home.
Original Mortgage
$52,800
Outstanding Balance
$47,994
Interest Rate
2.73%
Mortgage Type
Future Advance Clause Open End Mortgage
Estimated Equity
$41,251
Purchase Details
Closed on
Mar 1, 2018
Sold by
Catfive Properties Llc
Bought by
Bell Katrina L
Purchase Details
Closed on
Mar 18, 2008
Sold by
Dario Myrna R and Dario Nepomuceno Z
Bought by
Catfive Properties Llc
Home Financials for this Owner
Home Financials are based on the most recent Mortgage that was taken out on this home.
Original Mortgage
$35,000
Interest Rate
6.1%
Mortgage Type
Commercial
Purchase Details
Closed on
Jan 1, 1987
Sold by
Dario Myrna R
Bought by
Dario Myrna R
Create a Home Valuation Report for This Property
The Home Valuation Report is an in-depth analysis detailing your home's value as well as a comparison with similar homes in the area
Home Values in the Area
Average Home Value in this Area
Purchase History
| Date | Buyer | Sale Price | Title Company |
|---|---|---|---|
| Kovacs Jason M | $66,000 | None Available | |
| Bell Katrina L | -- | None Available | |
| Catfive Properties Llc | $35,000 | Attorney | |
| Dario Myrna R | -- | -- |
Source: Public Records
Mortgage History
| Date | Status | Borrower | Loan Amount |
|---|---|---|---|
| Open | Kovacs Jason M | $52,800 | |
| Previous Owner | Catfive Properties Llc | $160,000 | |
| Previous Owner | Catfive Properties Llc | $35,000 |
Source: Public Records
Tax History Compared to Growth
Tax History
| Year | Tax Paid | Tax Assessment Tax Assessment Total Assessment is a certain percentage of the fair market value that is determined by local assessors to be the total taxable value of land and additions on the property. | Land | Improvement |
|---|---|---|---|---|
| 2024 | $1,367 | $23,440 | $4,050 | $19,390 |
| 2023 | $853 | $13,420 | $4,490 | $8,930 |
| 2022 | $853 | $13,422 | $4,494 | $8,928 |
| 2021 | $1,069 | $13,422 | $4,494 | $8,928 |
| 2020 | $819 | $13,420 | $4,490 | $8,930 |
| 2019 | $821 | $13,420 | $4,490 | $8,930 |
| 2018 | $818 | $13,420 | $4,490 | $8,930 |
| 2017 | $802 | $12,600 | $4,370 | $8,230 |
| 2016 | $796 | $12,600 | $4,370 | $8,230 |
| 2015 | $796 | $12,600 | $4,370 | $8,230 |
| 2014 | $741 | $11,770 | $4,080 | $7,690 |
| 2013 | $687 | $11,770 | $4,080 | $7,690 |
Source: Public Records
Map
Nearby Homes
- 35 Laipple St
- 62 Laipple St
- 508 W Bennett
- 516 Bennett St
- 129-131 S Huron St
- 211 Scotts Ln
- 220 N Wabash St
- 400 Ontario St Unit 402
- 301 N Huron St
- 219 S York St
- 810 Howard St
- 108 S Penn St
- 405 S Broadway St
- 18 Virginia St
- 31 Vermont St
- 443 N Front St
- 20 Ohio St
- 438 N Front St
- 67730 Kirkwood Heights Rd
- 116 Iowa St