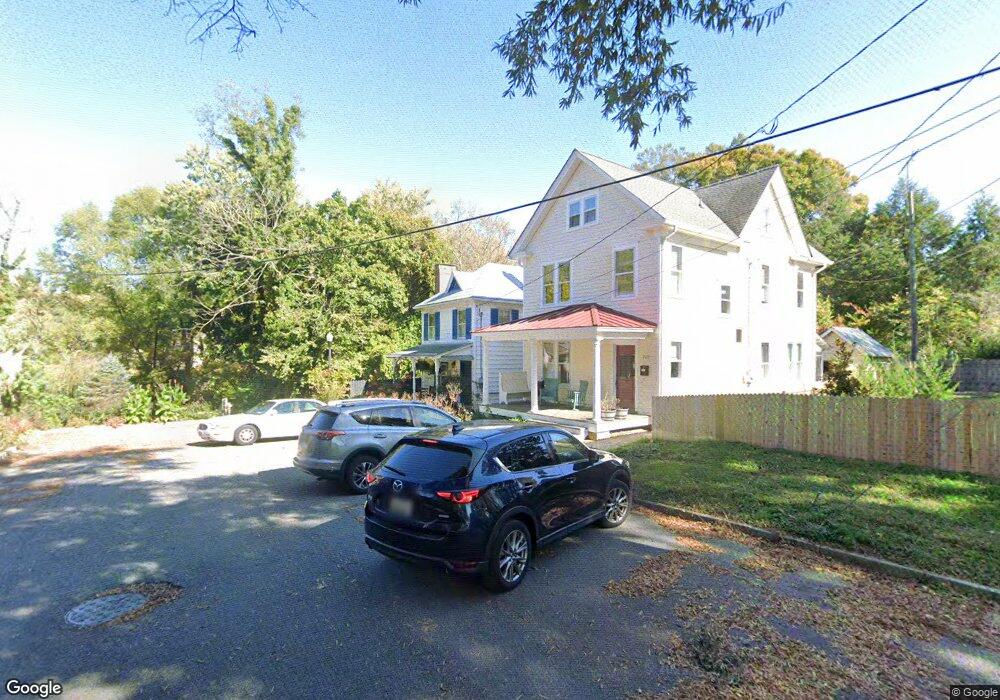
211 N Mill St Chestertown, MD 21620
Estimated Value: $221,000 - $377,000
2
Beds
2
Baths
1,152
Sq Ft
$236/Sq Ft
Est. Value
About This Home
This home is located at 211 N Mill St, Chestertown, MD 21620 and is currently estimated at $272,001, approximately $236 per square foot. 211 N Mill St is a home located in Kent County with nearby schools including Kent County Middle School, Kent County High School, and Chestertown Christian Academy.
Ownership History
Date
Name
Owned For
Owner Type
Purchase Details
Closed on
Jun 21, 2011
Sold by
Trinity Blakcthorn Llc
Bought by
Stewart Anne E
Current Estimated Value
Home Financials for this Owner
Home Financials are based on the most recent Mortgage that was taken out on this home.
Original Mortgage
$149,400
Outstanding Balance
$103,859
Interest Rate
4.81%
Mortgage Type
New Conventional
Estimated Equity
$168,142
Purchase Details
Closed on
May 27, 2011
Sold by
Trinity Blackthorn Llc
Bought by
Stewart Anne E
Home Financials for this Owner
Home Financials are based on the most recent Mortgage that was taken out on this home.
Original Mortgage
$149,400
Outstanding Balance
$103,859
Interest Rate
4.81%
Mortgage Type
New Conventional
Estimated Equity
$168,142
Purchase Details
Closed on
Feb 17, 2000
Sold by
Hopkins Evelyn S
Bought by
Trinity Blackthorn Llc
Create a Home Valuation Report for This Property
The Home Valuation Report is an in-depth analysis detailing your home's value as well as a comparison with similar homes in the area
Home Values in the Area
Average Home Value in this Area
Purchase History
| Date | Buyer | Sale Price | Title Company |
|---|---|---|---|
| Stewart Anne E | $166,000 | -- | |
| Stewart Anne E | $166,000 | -- | |
| Stewart Anne E | $166,000 | Sage Title Group Llc | |
| Stewart Anne E | $166,000 | -- | |
| Stewart Anne E | $166,000 | -- | |
| Trinity Blackthorn Llc | $100,000 | -- |
Source: Public Records
Mortgage History
| Date | Status | Borrower | Loan Amount |
|---|---|---|---|
| Open | Stewart Anne E | $149,400 | |
| Closed | Stewart Anne E | $149,400 | |
| Closed | Stewart Anne E | $149,400 |
Source: Public Records
Tax History
| Year | Tax Paid | Tax Assessment Tax Assessment Total Assessment is a certain percentage of the fair market value that is determined by local assessors to be the total taxable value of land and additions on the property. | Land | Improvement |
|---|---|---|---|---|
| 2025 | $2,547 | $162,500 | $140,100 | $22,400 |
| 2024 | $2,521 | $160,867 | $0 | $0 |
| 2023 | $2,496 | $159,233 | $0 | $0 |
| 2022 | $2,454 | $157,600 | $140,100 | $17,500 |
| 2021 | $2,465 | $157,433 | $0 | $0 |
| 2020 | $2,465 | $157,267 | $0 | $0 |
| 2019 | $2,457 | $157,100 | $140,100 | $17,000 |
| 2018 | $2,441 | $157,100 | $140,100 | $17,000 |
| 2017 | $2,363 | $157,100 | $0 | $0 |
| 2016 | -- | $157,100 | $0 | $0 |
| 2015 | $2,849 | $157,100 | $0 | $0 |
| 2014 | $2,849 | $157,100 | $0 | $0 |
Source: Public Records
Map
Nearby Homes
- 349 & 351 High St
- 349 High St
- 222 Mount Vernon Ave
- 234 N College Ave
- 106 S Queen St
- 109 S College Ave
- 201 N Lynchburg St
- 611 Cannon St
- 105 High St
- 117 N Water St Unit 1A, 1B, 2A, & 2B
- 117 N Water St Unit 2B
- 117 N Water St Unit 2A
- 117 N Water St Unit 1A
- 117 N Water St Unit 1B
- 202 Waldo Dr
- 132 Prospect St
- 139 Prospect St
- 228 S Water St
- 206 S Water St
- 515 N Kent St
Your Personal Tour Guide
Ask me questions while you tour the home.