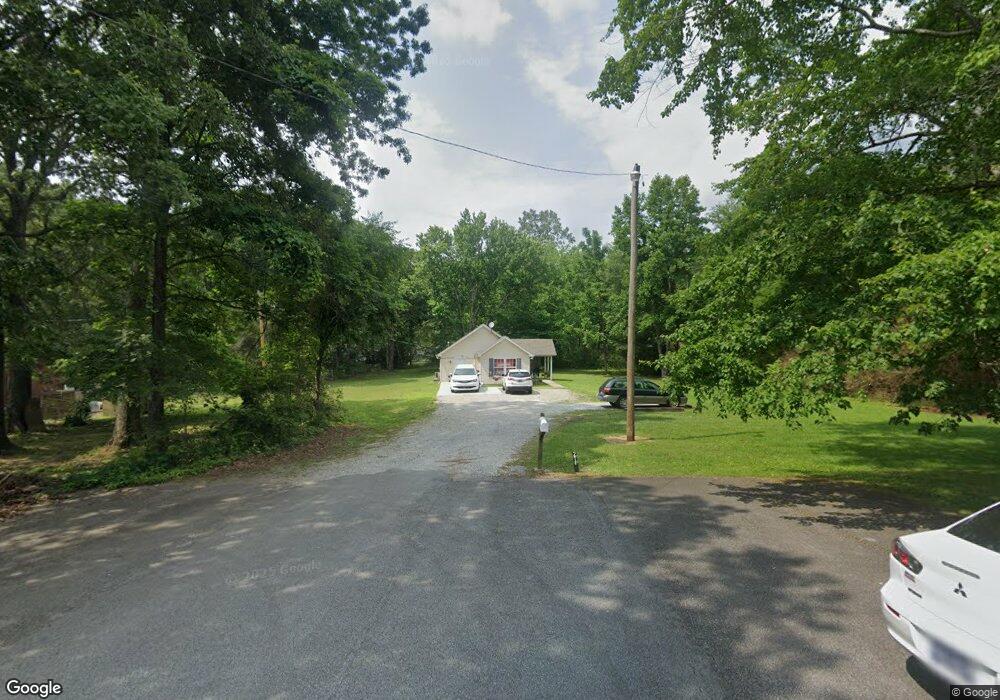
211 Parkway W Dickson, TN 37055
Estimated Value: $264,725 - $308,000
--
Bed
2
Baths
1,082
Sq Ft
$258/Sq Ft
Est. Value
About This Home
This home is located at 211 Parkway W, Dickson, TN 37055 and is currently estimated at $279,681, approximately $258 per square foot. 211 Parkway W is a home located in Dickson County with nearby schools including Centennial Elementary School, Dickson Middle School, and Dickson County High School.
Ownership History
Date
Name
Owned For
Owner Type
Purchase Details
Closed on
May 24, 2010
Sold by
Tennessee Housing Developm
Bought by
Developmental Svcs Of Dickson
Current Estimated Value
Purchase Details
Closed on
Jun 26, 2009
Sold by
Herman Charles R
Bought by
Tennessee Housing Development
Purchase Details
Closed on
Nov 29, 2006
Sold by
Homesales Inc
Bought by
Herman Charles R
Home Financials for this Owner
Home Financials are based on the most recent Mortgage that was taken out on this home.
Original Mortgage
$93,877
Interest Rate
6.29%
Purchase Details
Closed on
Feb 27, 2004
Sold by
C & C Investments
Bought by
Powers Miranda J
Home Financials for this Owner
Home Financials are based on the most recent Mortgage that was taken out on this home.
Original Mortgage
$92,500
Interest Rate
5.68%
Purchase Details
Closed on
Feb 6, 2003
Sold by
Adams Berry D
Bought by
C & C Investments Inc
Purchase Details
Closed on
Apr 16, 1975
Bought by
Atkins Louise
Create a Home Valuation Report for This Property
The Home Valuation Report is an in-depth analysis detailing your home's value as well as a comparison with similar homes in the area
Home Values in the Area
Average Home Value in this Area
Purchase History
| Date | Buyer | Sale Price | Title Company |
|---|---|---|---|
| Developmental Svcs Of Dickson | $91,000 | -- | |
| Tennessee Housing Development | $92,650 | -- | |
| Herman Charles R | $92,000 | -- | |
| Powers Miranda J | $92,500 | -- | |
| C & C Investments Inc | $12,000 | -- | |
| Atkins Louise | -- | -- |
Source: Public Records
Mortgage History
| Date | Status | Borrower | Loan Amount |
|---|---|---|---|
| Previous Owner | Atkins Louise | $93,877 | |
| Previous Owner | Atkins Louise | $92,500 |
Source: Public Records
Tax History Compared to Growth
Tax History
| Year | Tax Paid | Tax Assessment Tax Assessment Total Assessment is a certain percentage of the fair market value that is determined by local assessors to be the total taxable value of land and additions on the property. | Land | Improvement |
|---|---|---|---|---|
| 2024 | -- | $0 | $0 | $0 |
| 2023 | -- | $0 | $0 | $0 |
| 2022 | $0 | $0 | $0 | $0 |
| 2021 | $0 | $0 | $0 | $0 |
| 2020 | $0 | $0 | $0 | $0 |
| 2019 | $0 | $0 | $0 | $0 |
| 2018 | $0 | $0 | $0 | $0 |
| 2017 | $0 | $0 | $0 | $0 |
| 2016 | $1,307 | $35,820 | $4,140 | $31,680 |
| 2015 | $1,185 | $30,540 | $4,140 | $26,400 |
| 2014 | $1,185 | $30,540 | $4,140 | $26,400 |
Source: Public Records
Map
Nearby Homes
- 202 Parkway W
- 3002 Highway 70 W
- 104 Westmeade Dr
- 103 C Oak Park Dr
- 2020 Highway 70 W
- 119 Silver Leaf Cir
- 1014 Post Oak Dr
- 117 Dewey Dr
- 0 White Oak Dr
- 829 Furnace Hollow Rd
- 0 Furnace Hollow Rd Unit RTC3001315
- 0 Furnace Hollow Rd Unit RTC3001314
- 0 Furnace Hollow Rd Unit RTC3001313
- 0 Furnace Hollow Rd Unit RTC3001312
- 0 Furnace Hollow Rd Unit RTC3001310
- 0 Furnace Hollow Rd Unit RTC3001307
- 0 Furnace Hollow Rd Unit RTC2940727
- 0 Furnace Hollow Rd
- 0 W First St
- 0 W Walnut St