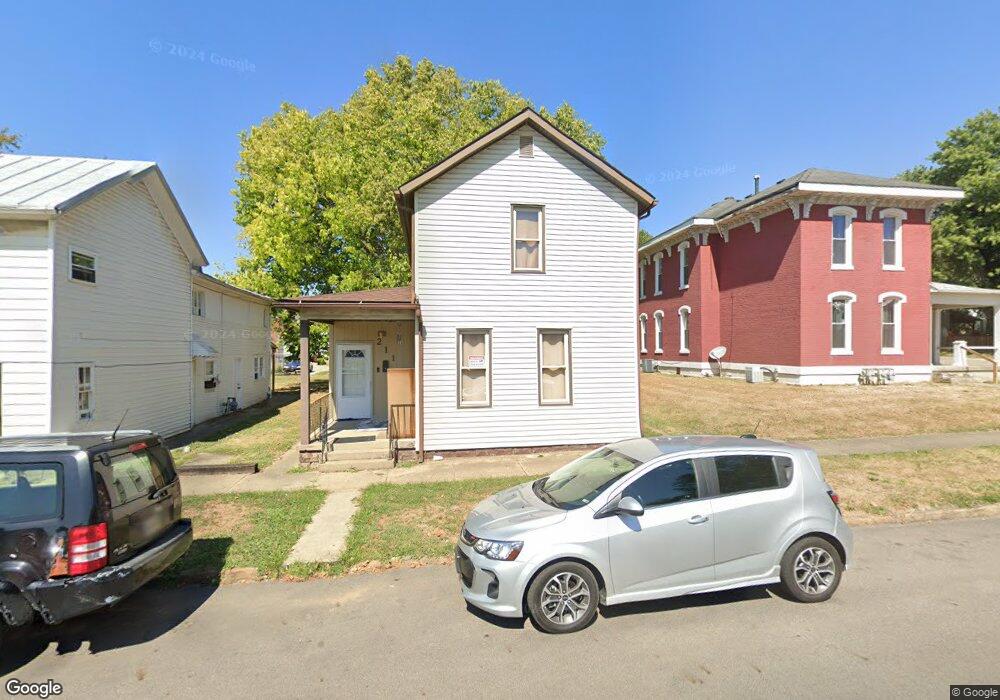
211 Perry St Lancaster, OH 43130
Estimated Value: $176,000 - $223,000
3
Beds
4
Baths
1,520
Sq Ft
$124/Sq Ft
Est. Value
About This Home
This home is located at 211 Perry St, Lancaster, OH 43130 and is currently estimated at $188,842, approximately $124 per square foot. 211 Perry St is a home located in Fairfield County with nearby schools including Thomas Ewing Junior High School, Lancaster High School, and St Mary Elementary School.
Ownership History
Date
Name
Owned For
Owner Type
Purchase Details
Closed on
Mar 6, 2017
Sold by
Farifield Federal Savings & Loan Associa
Bought by
Gilroc Rentals Ltd
Current Estimated Value
Home Financials for this Owner
Home Financials are based on the most recent Mortgage that was taken out on this home.
Original Mortgage
$45,000
Outstanding Balance
$29,350
Interest Rate
4.09%
Mortgage Type
Purchase Money Mortgage
Estimated Equity
$159,492
Purchase Details
Closed on
Jun 17, 2016
Sold by
Konkler Stacy K
Bought by
Gilroc Rentals Ltd
Home Financials for this Owner
Home Financials are based on the most recent Mortgage that was taken out on this home.
Interest Rate
3.54%
Purchase Details
Closed on
May 7, 2001
Sold by
Schmelzer Hubert J
Bought by
Konkler Stacy K
Home Financials for this Owner
Home Financials are based on the most recent Mortgage that was taken out on this home.
Original Mortgage
$63,000
Interest Rate
6.95%
Mortgage Type
New Conventional
Create a Home Valuation Report for This Property
The Home Valuation Report is an in-depth analysis detailing your home's value as well as a comparison with similar homes in the area
Home Values in the Area
Average Home Value in this Area
Purchase History
| Date | Buyer | Sale Price | Title Company |
|---|---|---|---|
| Gilroc Rentals Ltd | $15,000 | Valmer Land Title Agency | |
| Gilroc Rentals Ltd | $50,000 | -- | |
| Konkler Stacy K | $70,000 | -- |
Source: Public Records
Mortgage History
| Date | Status | Borrower | Loan Amount |
|---|---|---|---|
| Open | Gilroc Rentals Ltd | $45,000 | |
| Previous Owner | Gilroc Rentals Ltd | -- | |
| Previous Owner | Konkler Stacy K | $63,000 |
Source: Public Records
Tax History
| Year | Tax Paid | Tax Assessment Tax Assessment Total Assessment is a certain percentage of the fair market value that is determined by local assessors to be the total taxable value of land and additions on the property. | Land | Improvement |
|---|---|---|---|---|
| 2025 | $3,297 | $49,780 | $7,640 | $42,140 |
| 2024 | $3,297 | $36,670 | $4,350 | $32,320 |
| 2023 | $1,363 | $36,670 | $4,350 | $32,320 |
| 2022 | $1,371 | $36,670 | $4,350 | $32,320 |
| 2021 | $837 | $21,000 | $4,350 | $16,650 |
| 2020 | $803 | $21,000 | $4,350 | $16,650 |
| 2019 | $765 | $21,000 | $4,350 | $16,650 |
| 2018 | $786 | $22,740 | $4,350 | $18,390 |
| 2017 | $786 | $20,490 | $4,700 | $15,790 |
| 2016 | $766 | $20,490 | $4,700 | $15,790 |
| 2015 | $764 | $19,820 | $4,700 | $15,120 |
| 2014 | $729 | $19,820 | $4,700 | $15,120 |
| 2013 | $729 | $19,820 | $4,700 | $15,120 |
Source: Public Records
Map
Nearby Homes
- 154 E Main St
- 0 N Columbus St
- 342 E Chestnut St
- 414 E Walnut St
- 335 Whiley Ave
- 233 Lewis Ave
- 249 N Pearl Ave
- 515 E Chestnut St
- 153 King St
- 0 Slocum Ave
- 534 E Wheeling St
- 810 4th St
- 233 Union St
- 547 E Mulberry St
- 515 N Columbus St
- 526 N Columbus St
- 600 N High St
- 301 Witte St
- 621 E Mulberry St
- 517 N Maple St
Your Personal Tour Guide
Ask me questions while you tour the home.