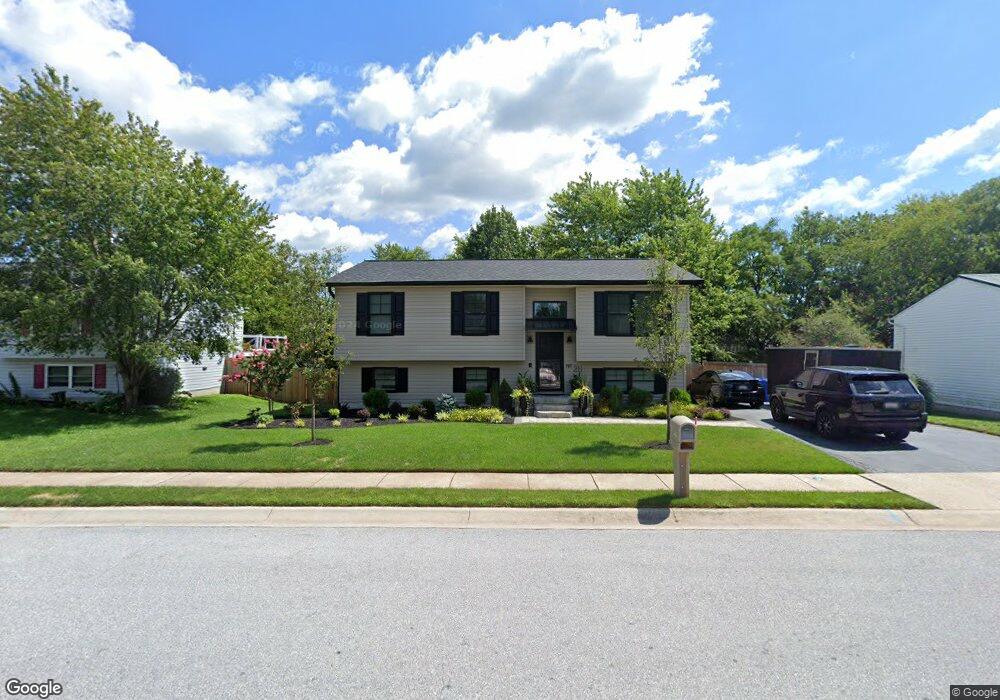
211 Roth Ave Taneytown, MD 21787
Estimated Value: $352,000 - $372,000
4
Beds
3
Baths
1,108
Sq Ft
$329/Sq Ft
Est. Value
About This Home
This home is located at 211 Roth Ave, Taneytown, MD 21787 and is currently estimated at $364,532, approximately $329 per square foot. 211 Roth Ave is a home located in Carroll County with nearby schools including Taneytown Elementary School, Northwest Middle School, and Francis Scott Key High School.
Ownership History
Date
Name
Owned For
Owner Type
Purchase Details
Closed on
Dec 8, 2015
Sold by
Kaiser Iva J and Kaiser Gregory
Bought by
Brunk Stacey
Current Estimated Value
Home Financials for this Owner
Home Financials are based on the most recent Mortgage that was taken out on this home.
Original Mortgage
$206,196
Outstanding Balance
$162,410
Interest Rate
3.75%
Mortgage Type
FHA
Estimated Equity
$202,122
Purchase Details
Closed on
Dec 12, 1991
Sold by
Foxfire Properties Inc
Bought by
Kaiser Gregory A and Kaiser Iva J
Purchase Details
Closed on
Oct 1, 1990
Sold by
Roberts Mill Development
Bought by
Foxfire Properties Inc
Create a Home Valuation Report for This Property
The Home Valuation Report is an in-depth analysis detailing your home's value as well as a comparison with similar homes in the area
Purchase History
| Date | Buyer | Sale Price | Title Company |
|---|---|---|---|
| Brunk Stacey | $210,000 | First American Title Ins Co | |
| Kaiser Gregory A | $105,000 | -- | |
| Foxfire Properties Inc | $308,000 | -- |
Source: Public Records
Mortgage History
| Date | Status | Borrower | Loan Amount |
|---|---|---|---|
| Open | Brunk Stacey | $206,196 |
Source: Public Records
Tax History
| Year | Tax Paid | Tax Assessment Tax Assessment Total Assessment is a certain percentage of the fair market value that is determined by local assessors to be the total taxable value of land and additions on the property. | Land | Improvement |
|---|---|---|---|---|
| 2025 | $4,215 | $291,033 | $0 | $0 |
| 2024 | $3,990 | $272,067 | $0 | $0 |
| 2023 | $3,771 | $253,100 | $104,800 | $148,300 |
| 2022 | $3,643 | $244,533 | $0 | $0 |
| 2021 | $7,079 | $235,967 | $0 | $0 |
| 2020 | $3,411 | $227,400 | $94,800 | $132,600 |
| 2019 | $3,348 | $223,233 | $0 | $0 |
| 2018 | $3,264 | $219,067 | $0 | $0 |
| 2017 | $3,202 | $214,900 | $0 | $0 |
| 2016 | -- | $209,500 | $0 | $0 |
| 2015 | -- | $191,400 | $0 | $0 |
| 2014 | -- | $186,000 | $0 | $0 |
Source: Public Records
Map
Nearby Homes
Your Personal Tour Guide
Ask me questions while you tour the home.