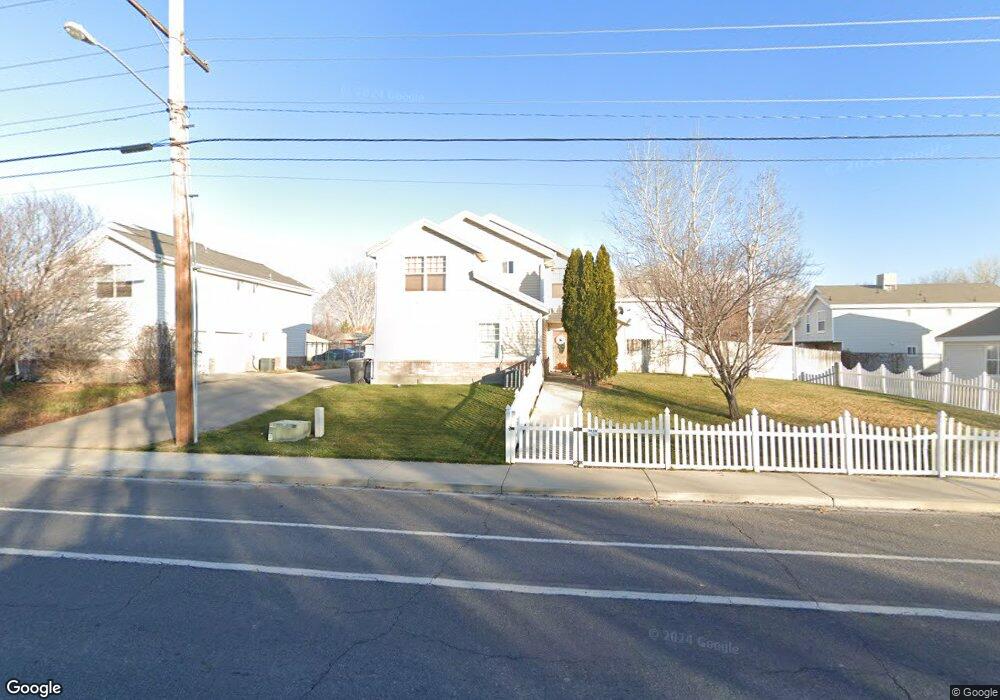
211 S 2050 W Provo, UT 84601
Franklin NeighborhoodEstimated Value: $462,000 - $483,000
4
Beds
3
Baths
1,660
Sq Ft
$284/Sq Ft
Est. Value
About This Home
This home is located at 211 S 2050 W, Provo, UT 84601 and is currently estimated at $471,040, approximately $283 per square foot. 211 S 2050 W is a home located in Utah County with nearby schools including Dixon Middle School, Provo High School, and Freedom Preparatory Academy.
Ownership History
Date
Name
Owned For
Owner Type
Purchase Details
Closed on
Feb 16, 2006
Sold by
Woodmansee Wade Alan and Woodmansee Carina
Bought by
Moreira Dinodes R and Moreira Jeannette L
Current Estimated Value
Home Financials for this Owner
Home Financials are based on the most recent Mortgage that was taken out on this home.
Original Mortgage
$156,750
Outstanding Balance
$88,244
Interest Rate
6.2%
Mortgage Type
Fannie Mae Freddie Mac
Estimated Equity
$382,796
Purchase Details
Closed on
Dec 28, 2001
Sold by
Broderick Van and Broderick Chad
Bought by
Woodmansee Wade Alan and Woodmansee Carina
Purchase Details
Closed on
Mar 28, 2001
Sold by
Chad Broderick Construction Inc
Bought by
Broderick Chad and Broderick Van
Home Financials for this Owner
Home Financials are based on the most recent Mortgage that was taken out on this home.
Original Mortgage
$181,000
Interest Rate
7.06%
Mortgage Type
Construction
Create a Home Valuation Report for This Property
The Home Valuation Report is an in-depth analysis detailing your home's value as well as a comparison with similar homes in the area
Home Values in the Area
Average Home Value in this Area
Purchase History
| Date | Buyer | Sale Price | Title Company |
|---|---|---|---|
| Moreira Dinodes R | -- | Provo Land Title Company | |
| Woodmansee Wade Alan | -- | First American Title Insuran | |
| Broderick Chad | -- | First American Title Co |
Source: Public Records
Mortgage History
| Date | Status | Borrower | Loan Amount |
|---|---|---|---|
| Open | Moreira Dinodes R | $156,750 | |
| Previous Owner | Broderick Chad | $181,000 |
Source: Public Records
Tax History
| Year | Tax Paid | Tax Assessment Tax Assessment Total Assessment is a certain percentage of the fair market value that is determined by local assessors to be the total taxable value of land and additions on the property. | Land | Improvement |
|---|---|---|---|---|
| 2025 | $2,260 | $237,325 | -- | -- |
| 2024 | $2,260 | $222,475 | $0 | $0 |
| 2023 | $2,226 | $216,040 | $0 | $0 |
| 2022 | $2,273 | $222,365 | $0 | $0 |
| 2021 | $1,822 | $310,900 | $82,500 | $228,400 |
| 2020 | $1,766 | $282,600 | $75,000 | $207,600 |
| 2019 | $1,556 | $258,900 | $75,000 | $183,900 |
| 2018 | $1,353 | $228,300 | $68,400 | $159,900 |
| 2017 | $1,297 | $120,230 | $0 | $0 |
| 2016 | $1,293 | $111,760 | $0 | $0 |
| 2015 | $1,201 | $104,885 | $0 | $0 |
| 2014 | $1,064 | $96,855 | $0 | $0 |
Source: Public Records
Map
Nearby Homes
- 312 S 1920 W
- 146 S 1860 W
- 2424 W 230 S
- 213 N Geneva Rd
- 1774 W 520 S
- 2471 W 180 S
- 1631 W 50 N
- 1541 W Lane Ct
- 89 S 1530 W
- 249 West Ln Unit 10
- 1505 W 100 S
- 255 N 1600 W Unit 148
- 255 N 1600 W Unit 108
- 255 N 1600 W Unit 94
- 255 N 1600 W Unit 73
- 154 N 2560 W
- 1309 Westbridge Cir
- 483 N 2430 W
- 579 N Geneva Rd
- 2507 W 520 N
- 221 S 2050 W
- 205 S 2050 W
- 197 S 2050 W
- 229 S 2050 W
- 201 S 2050 W Unit 2
- 201 S 2050 W
- 201 S 2050 W Unit 4
- 203 S 2050 W
- 203 S 2050 W Unit 9
- 203 S 2050 W Unit 6
- 207 S 2050 W Unit 18
- 213 S 2050 W
- 183 S 2050 W
- 245 S 2050 W
- 237 S 2050 W
- 182 West Ln Unit 28
- 249 S 2050 W
- 167 S 2050 W
- 169 S 2050 W
- 177 S 2050 W
Your Personal Tour Guide
Ask me questions while you tour the home.