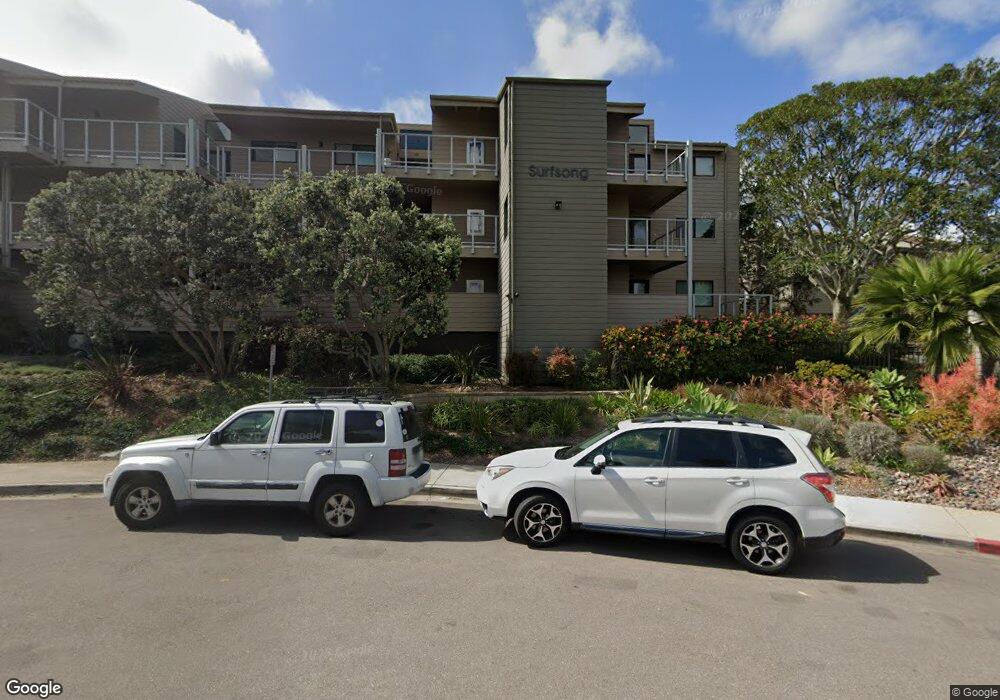
211 S Helix Ave Unit A Solana Beach, CA 92075
Estimated Value: $2,318,000 - $2,833,319
3
Beds
3
Baths
1,878
Sq Ft
$1,328/Sq Ft
Est. Value
About This Home
This home is located at 211 S Helix Ave Unit A, Solana Beach, CA 92075 and is currently estimated at $2,494,106, approximately $1,328 per square foot. 211 S Helix Ave Unit A is a home located in San Diego County with nearby schools including Skyline Elementary School, Solana Vista Elementary School, and Earl Warren Middle School.
Ownership History
Date
Name
Owned For
Owner Type
Purchase Details
Closed on
Dec 2, 2004
Sold by
Stevens Jana C and Stevens James G
Bought by
Stevens Jana C and Stevens James G
Current Estimated Value
Home Financials for this Owner
Home Financials are based on the most recent Mortgage that was taken out on this home.
Original Mortgage
$808,400
Outstanding Balance
$402,419
Interest Rate
5.64%
Mortgage Type
Seller Take Back
Estimated Equity
$2,091,687
Purchase Details
Closed on
May 30, 2001
Sold by
Bonds Scott W
Bought by
Bonds Scott W
Purchase Details
Closed on
Oct 22, 1996
Sold by
K K Felix Avenue 1993 Trust and M H K Felix Avenue 1993 Trust
Bought by
Knievel Kelly
Purchase Details
Closed on
Oct 18, 1996
Sold by
Knievel Kelly
Bought by
Bonds Scott W
Purchase Details
Closed on
Mar 2, 1992
Purchase Details
Closed on
Apr 28, 1989
Create a Home Valuation Report for This Property
The Home Valuation Report is an in-depth analysis detailing your home's value as well as a comparison with similar homes in the area
Home Values in the Area
Average Home Value in this Area
Purchase History
| Date | Buyer | Sale Price | Title Company |
|---|---|---|---|
| Stevens Jana C | $860,000 | -- | |
| Bonds Scott W | -- | -- | |
| Knievel Kelly | -- | First American Title | |
| Bonds Scott W | $625,000 | First American Title | |
| -- | $650,000 | -- | |
| -- | $530,000 | -- |
Source: Public Records
Mortgage History
| Date | Status | Borrower | Loan Amount |
|---|---|---|---|
| Open | Stevens Jana C | $808,400 |
Source: Public Records
Tax History Compared to Growth
Tax History
| Year | Tax Paid | Tax Assessment Tax Assessment Total Assessment is a certain percentage of the fair market value that is determined by local assessors to be the total taxable value of land and additions on the property. | Land | Improvement |
|---|---|---|---|---|
| 2025 | $16,732 | $1,540,978 | $1,198,759 | $342,219 |
| 2024 | $16,732 | $1,510,763 | $1,175,254 | $335,509 |
| 2023 | $16,382 | $1,481,141 | $1,152,210 | $328,931 |
| 2022 | $16,131 | $1,452,100 | $1,129,618 | $322,482 |
| 2021 | $15,857 | $1,423,628 | $1,107,469 | $316,159 |
| 2020 | $15,724 | $1,409,032 | $1,096,114 | $312,918 |
| 2019 | $15,219 | $1,361,405 | $1,074,622 | $286,783 |
| 2018 | $14,925 | $1,334,711 | $1,053,551 | $281,160 |
| 2017 | $14,666 | $1,308,542 | $1,032,894 | $275,648 |
| 2016 | $13,802 | $1,282,886 | $1,012,642 | $270,244 |
| 2015 | $13,589 | $1,263,617 | $997,432 | $266,185 |
| 2014 | $13,305 | $1,238,865 | $977,894 | $260,971 |
Source: Public Records
Map
Nearby Homes
- 241 S Sierra Ave
- 325 S Sierra Ave Unit 20
- 429 S Sierra Ave Unit 151
- 441 S Sierra Ave Unit 208
- 429 S Sierra Ave Unit 324
- 435 S Sierra Ave Unit 114
- 147 S Rios Ave
- 515 S Sierra Ave Unit 124
- 148 N Acacia Ave
- 585 S Sierra Ave Unit 27
- 521 S Rios Ave
- 308 Corto St
- 675 S Sierra Ave Unit 40
- 707 S Sierra Ave Unit 14
- 190 Del Mar Shores Terrace Unit 80
- 190 Del Mar Shores Terrace Unit 42
- 747 S Cedros Ave
- Plan 5 at Drift
- Plan 2 at Drift
- Plan 1 at Drift
- 211 S Helix Ave Unit 54
- 211 S Helix Ave Unit B
- 211 S Helix Ave Unit E
- 211 S Helix Ave Unit D
- 211 S Helix Ave Unit C
- 239 S Helix Ave Unit 7
- 245 S Helix Ave
- 239 S Helix Ave Unit C 8
- 239 S Helix Ave Unit 8
- 205 S Helix Ave Unit 65
- 233 S Helix Ave Unit S
- 233 S Helix Ave Unit ID1255609P
- 239 S Helix Ave Unit ID1292599P
- 239 S Helix Ave Unit ID1255609P
- 233 S Helix Ave Unit 47
- 233 S Helix Ave Unit 19
- 239 S Helix Ave Unit A-6
- 239 S Helix Ave Unit 6
- 245 S Helix Ave Unit 4
- 239 S Helix Ave Unit 35