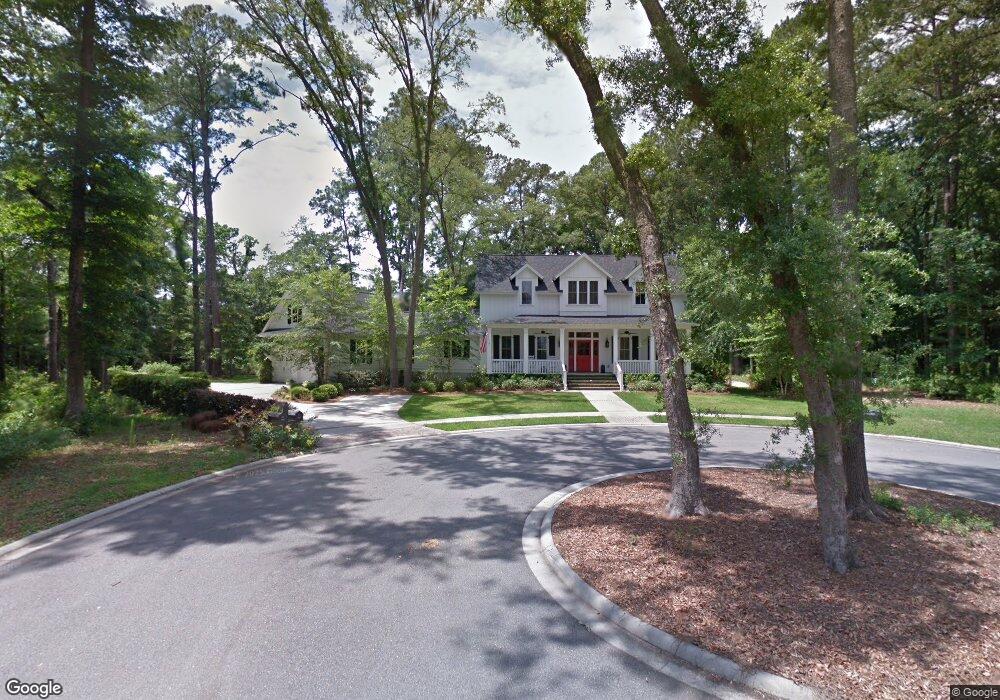
211 Schooner Dr Savannah, GA 31410
Whitemarsh Island NeighborhoodEstimated Value: $1,345,674 - $1,564,000
3
Beds
5
Baths
3,820
Sq Ft
$380/Sq Ft
Est. Value
About This Home
This home is located at 211 Schooner Dr, Savannah, GA 31410 and is currently estimated at $1,451,169, approximately $379 per square foot. 211 Schooner Dr is a home located in Chatham County with nearby schools including Marshpoint Elementary School, Coastal Middle School, and Islands High School.
Ownership History
Date
Name
Owned For
Owner Type
Purchase Details
Closed on
Apr 19, 2012
Sold by
Martin Katherine W
Bought by
Martin Katherine W and Martin Harlan B
Current Estimated Value
Purchase Details
Closed on
Jan 10, 2011
Sold by
Bouy Rose
Bought by
Wilson William A and Martin Katherine W
Purchase Details
Closed on
Feb 20, 2009
Sold by
Bouy Mark
Bought by
Bouy Rose
Purchase Details
Closed on
Feb 19, 2008
Sold by
Not Provided
Bought by
Wilson William A and Martin Katherine W
Home Financials for this Owner
Home Financials are based on the most recent Mortgage that was taken out on this home.
Original Mortgage
$700,000
Interest Rate
5.46%
Mortgage Type
New Conventional
Create a Home Valuation Report for This Property
The Home Valuation Report is an in-depth analysis detailing your home's value as well as a comparison with similar homes in the area
Home Values in the Area
Average Home Value in this Area
Purchase History
We collect this data history from publicly available records. To have your information removed, we recommend requesting removal directly through your county’s website.
| Date | Buyer | Sale Price | Title Company |
|---|---|---|---|
| Martin Katherine W | -- | -- | |
| Martin Katherine W | -- | -- | |
| Wilson William A | $665,000 | -- | |
| Wilson William A | $665,000 | -- | |
| Bouy Rose | -- | -- | |
| Wilson William A | $275,000 | -- |
Source: Public Records
Mortgage History
We collect this data history from publicly available records. To have your information removed, we recommend requesting removal directly through your county’s website.
| Date | Status | Borrower | Loan Amount |
|---|---|---|---|
| Previous Owner | Wilson William A | $700,000 |
Source: Public Records
Tax History
| Year | Tax Paid | Tax Assessment Tax Assessment Total Assessment is a certain percentage of the fair market value that is determined by local assessors to be the total taxable value of land and additions on the property. | Land | Improvement |
|---|---|---|---|---|
| 2025 | $8,400 | $537,960 | $110,000 | $427,960 |
| 2024 | $59 | $534,040 | $110,000 | $424,040 |
| 2023 | $5,922 | $494,200 | $61,200 | $433,000 |
| 2022 | $4,377 | $471,080 | $61,200 | $409,880 |
| 2021 | $6,744 | $410,040 | $61,200 | $348,840 |
| 2020 | $6,757 | $289,360 | $61,200 | $228,160 |
| 2019 | $6,795 | $289,360 | $61,200 | $228,160 |
| 2018 | $4,602 | $280,440 | $61,200 | $219,240 |
| 2017 | $4,691 | $281,720 | $61,200 | $220,520 |
| 2016 | $4,308 | $278,520 | $61,200 | $217,320 |
| 2015 | $13,077 | $282,160 | $62,240 | $219,920 |
| 2014 | $12,810 | $282,080 | $0 | $0 |
Source: Public Records
Map
Nearby Homes
- 344 Bradley Point Rd
- 711 Bradley Point Rd
- 324 Bradley Point Rd
- 104 Commodore Dr
- 308 Bradley Point Rd
- 4101 Walden Park Dr
- 6 Cedar View Ct
- 5204 Walden Park Dr
- 3307 Walden Park Dr
- 9301 Walden Park Dr
- 1304 Walden Park Dr
- 10 Autumn Leaves Ct
- 306 Redan Dr
- 1924 Whitemarsh Way
- 1735 Whitemarsh Way
- 1733 Whitemarsh Way
- 135 Marsh Harbor Dr S
- 127 Marsh Harbor Dr S
- 1723 Whitemarsh Way
- 2112 Whitemarsh Way
- 210 Schooner Dr
- 209 Schooner Dr
- 6 Marsh Dr
- 8 Marsh Dr
- 208 Schooner Dr
- 4 Marsh Dr
- 207 Schooner Dr
- 10 Marsh Dr
- 10 Marsh Dr
- 209 Commodore Dr
- 2 Marsh Dr
- 211 Commodore Dr
- 104 Country Club Dr
- 205 Commodore Dr
- 102 Country Club Dr
- 205 Schooner Dr
- 1 Marsh Dr
- 5 Marsh Dr
- 103 Bradley Point Rd
- 106 Country Club Dr
Your Personal Tour Guide
Ask me questions while you tour the home.