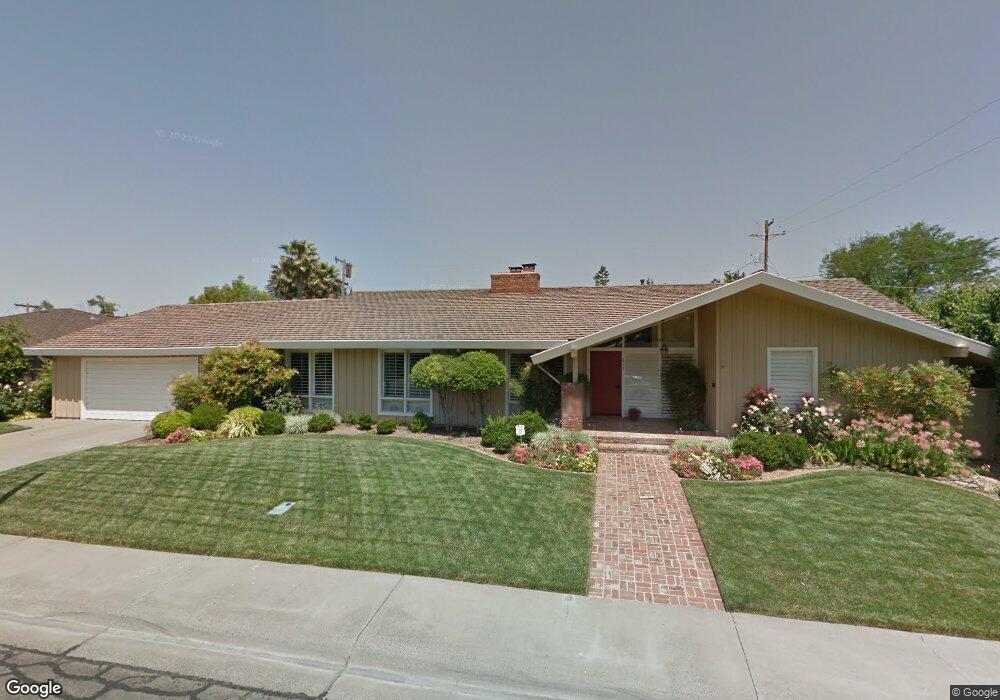
211 Toyon Dr Woodland, CA 95695
Estimated Value: $583,000 - $793,857
2
Beds
3
Baths
2,756
Sq Ft
$257/Sq Ft
Est. Value
About This Home
This home is located at 211 Toyon Dr, Woodland, CA 95695 and is currently estimated at $708,714, approximately $257 per square foot. 211 Toyon Dr is a home located in Yolo County with nearby schools including Gibson Elementary School, Lee Middle School, and Woodland Senior High School.
Ownership History
Date
Name
Owned For
Owner Type
Purchase Details
Closed on
Apr 7, 2020
Sold by
Scarlett Thomas R and Scarlett Elaine S
Bought by
Scarlett Thomas R and Scarlett Elaine S
Current Estimated Value
Home Financials for this Owner
Home Financials are based on the most recent Mortgage that was taken out on this home.
Original Mortgage
$500,000
Outstanding Balance
$346,362
Interest Rate
3.2%
Mortgage Type
New Conventional
Estimated Equity
$362,352
Purchase Details
Closed on
Feb 19, 2016
Sold by
Scarlett Thomas R and Scarlett Elaine S
Bought by
The Scarlett Family Revocable Trust Agre
Home Financials for this Owner
Home Financials are based on the most recent Mortgage that was taken out on this home.
Original Mortgage
$100,000
Interest Rate
3.92%
Mortgage Type
Credit Line Revolving
Purchase Details
Closed on
Jan 6, 1994
Sold by
Scarlett Thomas Roy and Scarlett Elaine Susan
Bought by
Scarlett Thomas R and Scarlett Elaine S
Create a Home Valuation Report for This Property
The Home Valuation Report is an in-depth analysis detailing your home's value as well as a comparison with similar homes in the area
Home Values in the Area
Average Home Value in this Area
Purchase History
| Date | Buyer | Sale Price | Title Company |
|---|---|---|---|
| Scarlett Thomas R | -- | Placer Title Company | |
| The Scarlett Family Revocable Trust Agre | -- | First American Title Company | |
| Scarlett Thomas R | -- | -- |
Source: Public Records
Mortgage History
| Date | Status | Borrower | Loan Amount |
|---|---|---|---|
| Open | Scarlett Thomas R | $500,000 | |
| Closed | The Scarlett Family Revocable Trust Agre | $100,000 |
Source: Public Records
Tax History Compared to Growth
Tax History
| Year | Tax Paid | Tax Assessment Tax Assessment Total Assessment is a certain percentage of the fair market value that is determined by local assessors to be the total taxable value of land and additions on the property. | Land | Improvement |
|---|---|---|---|---|
| 2025 | $5,505 | $541,130 | $173,316 | $367,814 |
| 2023 | $5,505 | $520,119 | $166,587 | $353,532 |
| 2022 | $5,287 | $509,921 | $163,321 | $346,600 |
| 2021 | $5,201 | $499,923 | $160,119 | $339,804 |
| 2020 | $5,126 | $494,798 | $158,478 | $336,320 |
| 2019 | $5,028 | $485,097 | $155,371 | $329,726 |
| 2018 | $4,976 | $475,586 | $152,325 | $323,261 |
| 2017 | $4,867 | $466,262 | $149,339 | $316,923 |
| 2016 | $4,782 | $457,120 | $146,411 | $310,709 |
| 2015 | $4,710 | $450,254 | $144,212 | $306,042 |
| 2014 | $4,620 | $441,436 | $141,388 | $300,048 |
Source: Public Records
Map
Nearby Homes
- 1609 Mckinley Ave
- 420 Delta Dr
- 436 Abbey Place
- 423 El Dorado Dr
- 1240 Eunice Dr
- 1328 College St
- 1208 West St
- 206 Los Robles Way
- 205 Bartlett Ave
- 6 Southwood Dr
- 1501 6th St
- 108 Clanton Ave
- 715 College St
- 221 Cross St
- 19435 East St
- 515 East St
- 420 W Southwood Dr
- 1249 Bray Dr
- 801-803 California St
- 608 College St Unit 8