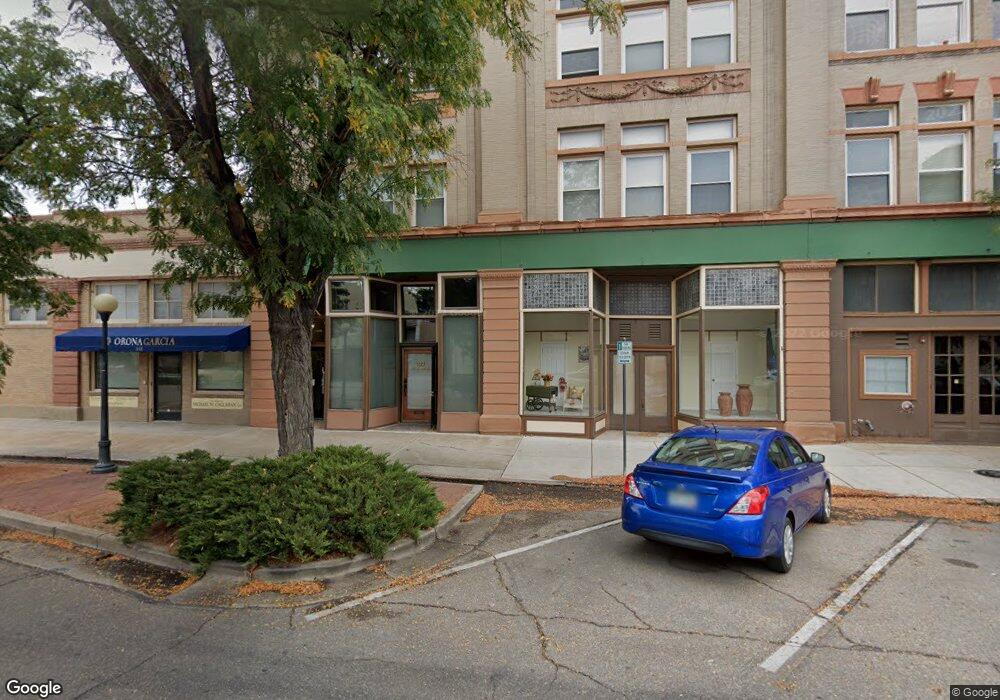
211 W 2nd St Unit 201 Pueblo, CO 81003
Downtown NeighborhoodEstimated Value: $272,701 - $440,000
2
Beds
3
Baths
1,530
Sq Ft
$211/Sq Ft
Est. Value
About This Home
This home is located at 211 W 2nd St Unit 201, Pueblo, CO 81003 and is currently estimated at $322,675, approximately $210 per square foot. 211 W 2nd St Unit 201 is a home located in Pueblo County with nearby schools including Bradford Elementary School, Risley International Academy of Innovation, and Centennial High School.
Ownership History
Date
Name
Owned For
Owner Type
Purchase Details
Closed on
Aug 27, 2019
Sold by
Fogg Jeffrey Gordan and Smith Charles Edward
Bought by
Smith Charles Edward
Current Estimated Value
Purchase Details
Closed on
Mar 1, 2017
Sold by
Fogg Jeffery G
Bought by
Smith Edward Charles and Fogg Jeffery G
Purchase Details
Closed on
Sep 15, 2006
Sold by
Cruse Todd R
Bought by
Fogg Jeffery G
Home Financials for this Owner
Home Financials are based on the most recent Mortgage that was taken out on this home.
Original Mortgage
$183,000
Interest Rate
9.65%
Mortgage Type
Balloon
Purchase Details
Closed on
Aug 23, 2004
Sold by
Trujillo Garbiel L
Bought by
Cruse Todd R
Purchase Details
Closed on
Apr 5, 2004
Bought by
Trujillo Garbiel L
Purchase Details
Closed on
Jul 31, 2003
Sold by
Anzuini Gary + Ida
Bought by
Amhearst Llc
Purchase Details
Closed on
Mar 18, 2002
Bought by
Anzuini Gary + Ida
Create a Home Valuation Report for This Property
The Home Valuation Report is an in-depth analysis detailing your home's value as well as a comparison with similar homes in the area
Home Values in the Area
Average Home Value in this Area
Purchase History
| Date | Buyer | Sale Price | Title Company |
|---|---|---|---|
| Smith Charles Edward | $5,000 | None Available | |
| Smith Edward Charles | -- | None Available | |
| Fogg Jeffery G | $183,000 | Stewart Title Of Colorado | |
| Cruse Todd R | $150,000 | -- | |
| Trujillo Garbiel L | $145,000 | -- | |
| Amhearst Llc | -- | -- | |
| Anzuini Gary + Ida | $225,000 | -- |
Source: Public Records
Mortgage History
| Date | Status | Borrower | Loan Amount |
|---|---|---|---|
| Previous Owner | Fogg Jeffery G | $183,000 |
Source: Public Records
Tax History Compared to Growth
Tax History
| Year | Tax Paid | Tax Assessment Tax Assessment Total Assessment is a certain percentage of the fair market value that is determined by local assessors to be the total taxable value of land and additions on the property. | Land | Improvement |
|---|---|---|---|---|
| 2024 | $1,738 | $18,180 | -- | -- |
| 2023 | $2,223 | $21,870 | $670 | $21,200 |
| 2022 | $2,041 | $17,310 | $700 | $16,610 |
| 2021 | $1,740 | $17,810 | $720 | $17,090 |
| 2020 | $1,438 | $17,810 | $720 | $17,090 |
| 2019 | $1,444 | $12,126 | $320 | $11,806 |
| 2018 | $1,171 | $10,781 | $322 | $10,459 |
| 2017 | $1,181 | $10,781 | $322 | $10,459 |
| 2016 | $1,222 | $11,879 | $356 | $11,523 |
| 2015 | $1,218 | $11,879 | $356 | $11,523 |
| 2014 | $1,201 | $11,691 | $356 | $11,335 |
Source: Public Records
Map
Nearby Homes
- 2154 Hwy 50
- 225 N Bradford Ave
- 235 W Riverwalk Unit 7
- 220 S Bradford Ave
- 525 W 7th St
- 201 Lamkin St Unit 207
- 201 Lamkin St Unit 205
- 201 Lamkin St Unit 204
- 201 Lamkin St Unit 104
- 201 Lamkin St Unit 106
- 609 W 8th St Unit 611
- 615 E 1st St
- 621 E 2nd St
- 616 E 5th St
- 117 W 11th St
- 111 W 11th St
- 520 W 11th St
- 711 E 3rd St
- 519 W 11th St Unit U CHOOSE
- 519 W 11th St
- 211 W 2nd St Unit 208
- 211 W 2nd St Unit 307
- 211 W 2nd St Unit 207
- 211 W 2nd St Unit 202
- 211 W 2nd St Unit 302
- 211 W 2nd St Unit 303
- 211 W 2nd St Unit 305
- 211 W 2nd St Unit 306
- 211 W 2nd St Unit 304
- 211 W 2nd St Unit 206
- 211 W 2nd St Unit 203
- 211 W 2nd St Unit 301
- 211 W 2nd St Unit 204
- 211 W 2nd St Unit 102
- 211 W 2nd St
- 201 N Main St
- 215 W 2nd St
- 215 2nd St
- 209 N Main St
- 205 N Main St