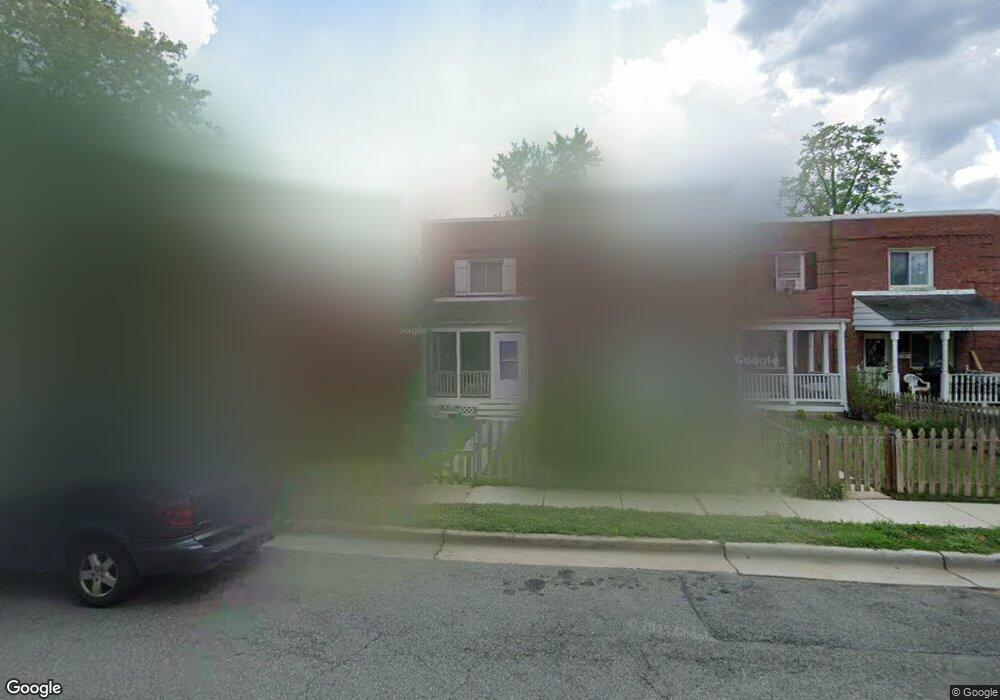
211 Wesmond Dr Alexandria, VA 22305
Del Ray NeighborhoodEstimated Value: $563,850 - $659,000
2
Beds
1
Bath
864
Sq Ft
$696/Sq Ft
Est. Value
About This Home
This home is located at 211 Wesmond Dr, Alexandria, VA 22305 and is currently estimated at $600,950, approximately $695 per square foot. 211 Wesmond Dr is a home located in Alexandria City with nearby schools including Cora Kelly Magnet Elementary, George Washington Middle School, and Alexandria City High School.
Ownership History
Date
Name
Owned For
Owner Type
Purchase Details
Closed on
Sep 18, 2020
Sold by
Lair Don L and Lair Sue V
Bought by
Lair Meredith H
Current Estimated Value
Purchase Details
Closed on
May 1, 2009
Sold by
Bennett Jeffrey A
Bought by
Lair Don L and Lair Meredith H
Home Financials for this Owner
Home Financials are based on the most recent Mortgage that was taken out on this home.
Original Mortgage
$240,000
Interest Rate
4.86%
Mortgage Type
New Conventional
Purchase Details
Closed on
Aug 18, 2003
Sold by
Hatcher Peter
Bought by
Bennett Jeffrey
Home Financials for this Owner
Home Financials are based on the most recent Mortgage that was taken out on this home.
Original Mortgage
$168,000
Interest Rate
5.46%
Mortgage Type
New Conventional
Purchase Details
Closed on
Dec 29, 1999
Sold by
Thieme James David
Bought by
Hatcher Peter W
Purchase Details
Closed on
Jul 8, 1997
Sold by
Stephanz Virginia L
Bought by
Thieme James D
Create a Home Valuation Report for This Property
The Home Valuation Report is an in-depth analysis detailing your home's value as well as a comparison with similar homes in the area
Home Values in the Area
Average Home Value in this Area
Purchase History
| Date | Buyer | Sale Price | Title Company |
|---|---|---|---|
| Lair Meredith H | $70,000 | None Available | |
| Lair Don L | $300,000 | -- | |
| Bennett Jeffrey | $210,000 | -- | |
| Hatcher Peter W | $376,500 | -- | |
| Thieme James D | -- | -- |
Source: Public Records
Mortgage History
| Date | Status | Borrower | Loan Amount |
|---|---|---|---|
| Previous Owner | Lair Don L | $240,000 | |
| Previous Owner | Thieme James D | $168,000 |
Source: Public Records
Tax History Compared to Growth
Tax History
| Year | Tax Paid | Tax Assessment Tax Assessment Total Assessment is a certain percentage of the fair market value that is determined by local assessors to be the total taxable value of land and additions on the property. | Land | Improvement |
|---|---|---|---|---|
| 2025 | $7,219 | $580,263 | $384,380 | $195,883 |
| 2024 | $7,219 | $580,263 | $384,380 | $195,883 |
| 2023 | $6,479 | $583,730 | $384,380 | $199,350 |
| 2022 | $6,222 | $560,514 | $361,790 | $198,724 |
| 2021 | $5,849 | $526,966 | $328,900 | $198,066 |
| 2020 | $5,875 | $497,066 | $299,000 | $198,066 |
| 2019 | $5,194 | $459,666 | $261,600 | $198,066 |
| 2018 | $5,194 | $459,666 | $261,600 | $198,066 |
| 2017 | $4,806 | $425,278 | $237,800 | $187,478 |
| 2016 | $4,211 | $392,478 | $205,000 | $187,478 |
| 2015 | $3,897 | $373,665 | $186,187 | $187,478 |
| 2014 | $3,853 | $369,372 | $180,764 | $188,608 |
Source: Public Records
Map
Nearby Homes
- 234 Wesmond Dr
- 221 Evans Ln
- 117 E Glebe Rd Unit B
- 309 Wesmond Dr
- 141 Lynhaven Dr
- 13 Auburn Ct Unit D
- 9 E Glebe Rd Unit C
- 181 E Reed Ave Unit 204
- 181 E Reed Ave Unit 206
- 181 E Reed Ave Unit 207
- 28 E Reed Ave
- 12 Ashby St Unit F
- 403a Hume Ave Unit A
- 401 Hume Ave Unit A
- 31 W Reed Ave
- 297 E Raymond Ave
- 317 Calvert Ave
- 313 Calvert Ave
- 5 Kennedy St
- Huntly Plan at Del Ray Corner At Oakville