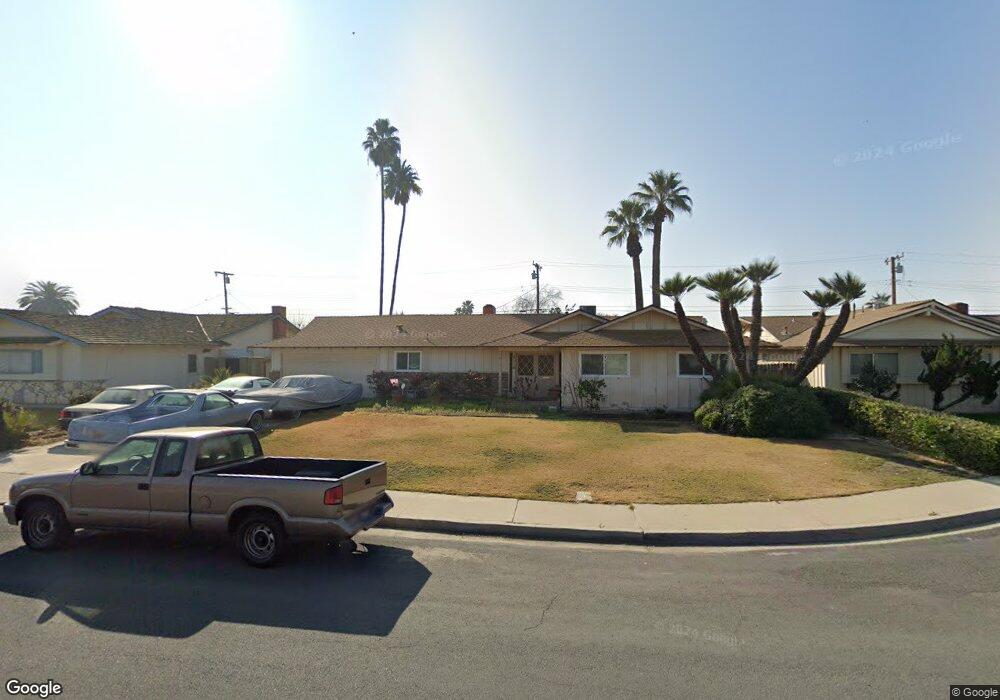
2110 7th Ave Delano, CA 93215
East Delano NeighborhoodEstimated Value: $320,000 - $343,000
3
Beds
2
Baths
1,395
Sq Ft
$235/Sq Ft
Est. Value
About This Home
This home is located at 2110 7th Ave, Delano, CA 93215 and is currently estimated at $327,805, approximately $234 per square foot. 2110 7th Ave is a home located in Kern County with nearby schools including Harvest Elementary School, La Vina Middle School, and Cesar E. Chavez High School.
Ownership History
Date
Name
Owned For
Owner Type
Purchase Details
Closed on
Aug 1, 2018
Sold by
Kemph Robert
Bought by
Kemph Robert
Current Estimated Value
Purchase Details
Closed on
Jun 8, 2009
Sold by
Kemph Melinda
Bought by
Kemph Robert
Home Financials for this Owner
Home Financials are based on the most recent Mortgage that was taken out on this home.
Original Mortgage
$104,000
Interest Rate
4.82%
Mortgage Type
Purchase Money Mortgage
Purchase Details
Closed on
Apr 16, 2009
Sold by
Kemph Thomas L and Kemph Family Trust
Bought by
Kemph Robert
Home Financials for this Owner
Home Financials are based on the most recent Mortgage that was taken out on this home.
Original Mortgage
$104,000
Interest Rate
4.82%
Mortgage Type
Purchase Money Mortgage
Purchase Details
Closed on
Oct 19, 1998
Sold by
Kemph Robert C and Kemph Joyce E
Bought by
Kemph Robert C and Kemph Joyce E
Create a Home Valuation Report for This Property
The Home Valuation Report is an in-depth analysis detailing your home's value as well as a comparison with similar homes in the area
Home Values in the Area
Average Home Value in this Area
Purchase History
| Date | Buyer | Sale Price | Title Company |
|---|---|---|---|
| Kemph Robert | -- | None Available | |
| Kemph Robert | -- | Ticor Title Company Of Ca | |
| Kemph Robert | $130,000 | Ticor Title Company Of Ca | |
| Kemph Robert C | -- | -- |
Source: Public Records
Mortgage History
| Date | Status | Borrower | Loan Amount |
|---|---|---|---|
| Previous Owner | Kemph Robert | $104,000 |
Source: Public Records
Tax History
| Year | Tax Paid | Tax Assessment Tax Assessment Total Assessment is a certain percentage of the fair market value that is determined by local assessors to be the total taxable value of land and additions on the property. | Land | Improvement |
|---|---|---|---|---|
| 2025 | $816 | $65,303 | $11,016 | $54,287 |
| 2024 | $788 | $64,023 | $10,800 | $53,223 |
| 2023 | $788 | $62,769 | $10,589 | $52,180 |
| 2022 | $769 | $61,539 | $10,382 | $51,157 |
| 2021 | $706 | $60,333 | $10,179 | $50,154 |
| 2020 | $691 | $59,715 | $10,075 | $49,640 |
| 2019 | $678 | $59,715 | $10,075 | $49,640 |
| 2018 | $669 | $57,398 | $9,685 | $47,713 |
| 2017 | $671 | $56,274 | $9,496 | $46,778 |
| 2016 | $659 | $55,171 | $9,310 | $45,861 |
| 2015 | $679 | $54,344 | $9,171 | $45,173 |
| 2014 | $635 | $53,281 | $8,992 | $44,289 |
Source: Public Records
Map
Nearby Homes
- 719 Union St
- 1901 6th Ave
- 2226 Via Tuscania Ave
- 1733 8th Ave
- 1642 7th Place
- 1518 9th Ave
- 1201 Quincy St
- 1309 5th Place
- 1612 Xenia Ct
- 800 Lexington St Unit 28
- 0 Cecil Ave
- 701 Madison St
- 1216 10th Ave
- 1736 17th Ave
- 1257 Oxford St
- 1732 17th Ave
- 1741 Vassar St
- 1115 Lexington St
- 1725 17th Place
- 119 S Lexington St
Your Personal Tour Guide
Ask me questions while you tour the home.