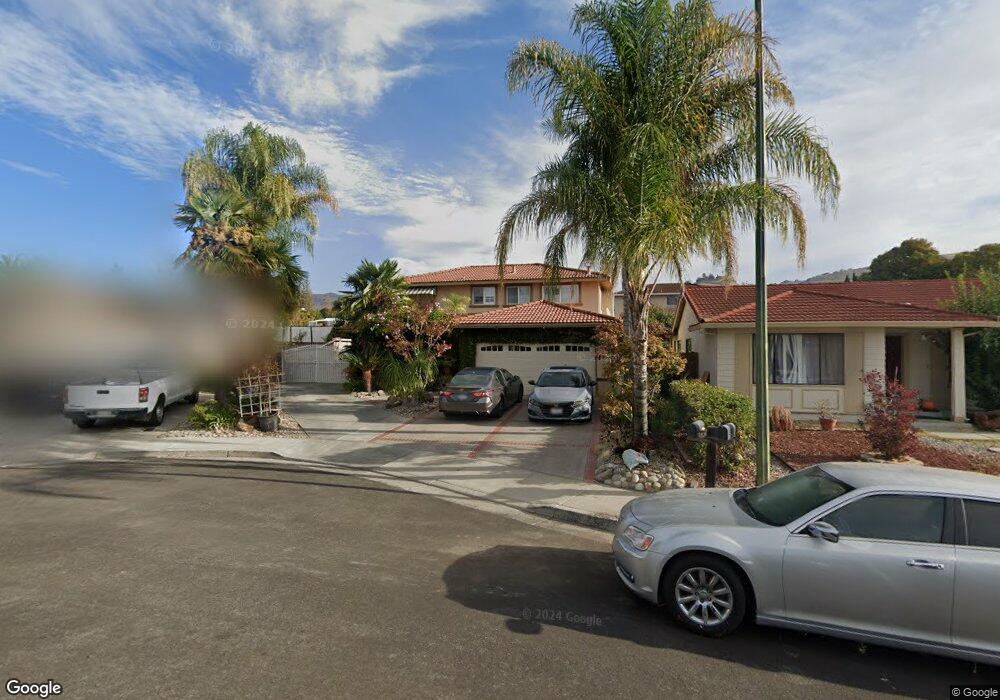
2110 Flintside Ct San Jose, CA 95148
Mount Pleasant NeighborhoodEstimated Value: $1,336,000 - $1,647,000
4
Beds
3
Baths
1,774
Sq Ft
$839/Sq Ft
Est. Value
About This Home
This home is located at 2110 Flintside Ct, San Jose, CA 95148 and is currently estimated at $1,488,757, approximately $839 per square foot. 2110 Flintside Ct is a home located in Santa Clara County with nearby schools including Mt. Pleasant High School, Ida Jew Academies, and Adelante Dual Language Academy.
Ownership History
Date
Name
Owned For
Owner Type
Purchase Details
Closed on
Oct 18, 2023
Sold by
Nguyen Tran Kim Thi and Nguyen Trung
Bought by
Trung Ta And Tran Nguyen Living Trust and Nguyen
Current Estimated Value
Purchase Details
Closed on
Aug 2, 2001
Sold by
Nguyen Tran and Ta Trung
Bought by
Nguyen Tran and Ta Trung
Home Financials for this Owner
Home Financials are based on the most recent Mortgage that was taken out on this home.
Original Mortgage
$250,000
Interest Rate
6.37%
Purchase Details
Closed on
May 13, 1999
Sold by
Nadeem Rahman and Hussain Sayed F
Bought by
Nguyen Tran and Ta Trung
Home Financials for this Owner
Home Financials are based on the most recent Mortgage that was taken out on this home.
Original Mortgage
$292,600
Interest Rate
7%
Create a Home Valuation Report for This Property
The Home Valuation Report is an in-depth analysis detailing your home's value as well as a comparison with similar homes in the area
Home Values in the Area
Average Home Value in this Area
Purchase History
| Date | Buyer | Sale Price | Title Company |
|---|---|---|---|
| Trung Ta And Tran Nguyen Living Trust | -- | None Listed On Document | |
| Nguyen Tran | $167,500 | Stewart Title | |
| Nguyen Tran | $308,000 | Financial Title Company |
Source: Public Records
Mortgage History
| Date | Status | Borrower | Loan Amount |
|---|---|---|---|
| Previous Owner | Nguyen Tran | $250,000 | |
| Previous Owner | Nguyen Tran | $292,600 |
Source: Public Records
Tax History Compared to Growth
Tax History
| Year | Tax Paid | Tax Assessment Tax Assessment Total Assessment is a certain percentage of the fair market value that is determined by local assessors to be the total taxable value of land and additions on the property. | Land | Improvement |
|---|---|---|---|---|
| 2025 | $11,597 | $765,139 | $289,901 | $475,238 |
| 2024 | $11,597 | $750,137 | $284,217 | $465,920 |
| 2023 | $11,266 | $735,430 | $278,645 | $456,785 |
| 2022 | $11,167 | $721,011 | $273,182 | $447,829 |
| 2021 | $11,189 | $706,875 | $267,826 | $439,049 |
| 2020 | $10,689 | $699,628 | $265,080 | $434,548 |
| 2019 | $9,973 | $685,911 | $259,883 | $426,028 |
| 2018 | $9,703 | $672,463 | $254,788 | $417,675 |
| 2017 | $9,576 | $659,279 | $249,793 | $409,486 |
| 2016 | $9,280 | $646,353 | $244,896 | $401,457 |
| 2015 | $9,288 | $636,645 | $241,218 | $395,427 |
| 2014 | $8,751 | $624,175 | $236,493 | $387,682 |
Source: Public Records
Map
Nearby Homes
- 2209 Fairmont Dr
- 3440 Rubion Dr
- 2277 Flint Ave
- 1925 Winding Creek Ct
- 3532 Boeger Ln
- 2145 Mount Pleasant Rd
- 3286 Dias Dr
- 2017 Flintbury Ct
- 2467 Flint Ave
- 3156 Coldwater Dr
- 3144 Coldwater Dr
- 3146 Marten Ave
- 3274 Mount Rainier Dr
- 3324 Trebol Ln
- 2689 Vista Verde Dr
- 3416 Mount Mckinley Ct
- 2703 Klein Rd
- 3514 Milburn St
- 2837 Mantis Dr
- 2195 Cunningham Ct
- 2118 Flintside Ct
- 2102 Flintside Ct
- 2123 Flintmore Ct
- 2129 Flintmore Ct
- 2126 Flintside Ct
- 2103 Flintside Ct
- 2133 Flintmore Ct
- 2115 Flintmore Ct
- 2119 Flintside Ct
- 3384 Guluzzo Dr
- 2111 Flintside Ct
- 2127 Flintside Ct
- 2134 Flintside Ct
- 3388 Guluzzo Dr
- 3380 Guluzzo Dr
- 2139 Flintmore Ct
- 3376 Guluzzo Dr
- 2135 Flintside Ct
- 3392 Guluzzo Dr
- 2116 Flintmore Ct