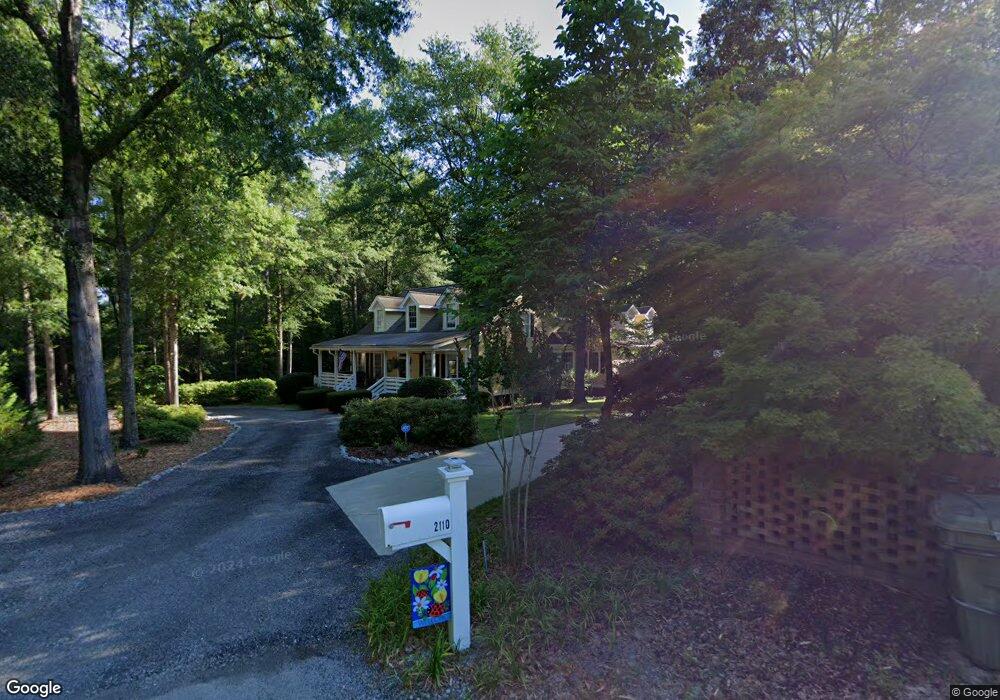
2110 Flynn Ln Camden, SC 29020
Estimated Value: $446,000 - $584,517
4
Beds
3
Baths
3,024
Sq Ft
$179/Sq Ft
Est. Value
About This Home
This home is located at 2110 Flynn Ln, Camden, SC 29020 and is currently estimated at $541,129, approximately $178 per square foot. 2110 Flynn Ln is a home located in Kershaw County with nearby schools including Camden Elementary of the Creative Arts, Pine Tree Hill Elementary School, and Camden Middle School.
Ownership History
Date
Name
Owned For
Owner Type
Purchase Details
Closed on
Jun 23, 2021
Sold by
Reid Jeffrey N
Bought by
Collins Dennis E and Collins Trudy A
Current Estimated Value
Home Financials for this Owner
Home Financials are based on the most recent Mortgage that was taken out on this home.
Original Mortgage
$185,000
Outstanding Balance
$167,129
Interest Rate
2.9%
Mortgage Type
New Conventional
Estimated Equity
$374,000
Purchase Details
Closed on
Sep 18, 2019
Sold by
Gibson Tucker H
Bought by
Reid Jeffrey N and Reid Heather D
Home Financials for this Owner
Home Financials are based on the most recent Mortgage that was taken out on this home.
Original Mortgage
$389,900
Interest Rate
3.6%
Mortgage Type
VA
Purchase Details
Closed on
May 9, 2014
Sold by
Sandt Joshua L and Sandt Amy ,
Bought by
Tucker H Gibson
Purchase Details
Closed on
Aug 21, 2006
Sold by
Cox William B and Cox Mary F
Bought by
Sandt Joshua L and Sandt Amy ,
Create a Home Valuation Report for This Property
The Home Valuation Report is an in-depth analysis detailing your home's value as well as a comparison with similar homes in the area
Home Values in the Area
Average Home Value in this Area
Purchase History
| Date | Buyer | Sale Price | Title Company |
|---|---|---|---|
| Collins Dennis E | $410,000 | Savage Royall & Sheheen Llp | |
| Reid Jeffrey N | -- | Cox William B | |
| Reid Jeffrey N | $389,900 | -- | |
| Tucker H Gibson | $369,000 | -- | |
| Sandt Joshua L | $375,000 | -- |
Source: Public Records
Mortgage History
| Date | Status | Borrower | Loan Amount |
|---|---|---|---|
| Open | Collins Dennis E | $185,000 | |
| Previous Owner | Reid Jeffrey N | $389,900 |
Source: Public Records
Tax History Compared to Growth
Tax History
| Year | Tax Paid | Tax Assessment Tax Assessment Total Assessment is a certain percentage of the fair market value that is determined by local assessors to be the total taxable value of land and additions on the property. | Land | Improvement |
|---|---|---|---|---|
| 2025 | $2,575 | $410,000 | $110,000 | $300,000 |
| 2024 | $2,575 | $410,000 | $110,000 | $300,000 |
| 2023 | $1,235 | $390,000 | $100,000 | $290,000 |
| 2022 | $2,024 | $390,000 | $100,000 | $290,000 |
| 2021 | $2,392 | $390,000 | $100,000 | $290,000 |
| 2020 | $2,392 | $389,900 | $80,000 | $309,900 |
| 2019 | $2,348 | $389,900 | $80,000 | $309,900 |
| 2018 | $2,375 | $369,400 | $60,000 | $309,400 |
| 2017 | $2,221 | $369,400 | $60,000 | $309,400 |
| 2016 | $2,228 | $369,400 | $60,000 | $309,400 |
| 2015 | -- | $369,400 | $60,000 | $309,400 |
| 2014 | $1,656 | $12,932 | $0 | $0 |
Source: Public Records
Map
Nearby Homes
- 314 Kirkwood Ln
- 2108 Broad St Unit 23
- 414 Greene St
- 602 Greene St
- 1009 Kirkwood Cir
- 1822 Brevard Place
- 415 Pine St
- 1710 Fair St
- 1700 Broad St
- 5 Ancrum Rd
- 2236 Carter St Unit Tract D
- 210 Carriagebrook Cir
- 20 Hunt Cup Ln
- 597 Hillsdale Dr
- 2224 Carter St Unit Tract C
- 618 Hampton St
- 702 Hampton St
- 1310 Lyttleton St
- 1302 Lyttleton St
- 25 Gazebo Ct
- 2110 Flynn Ave
- 2116 Flynn Ave
- 406 Kirkwood Ln
- 404 Kirkwood Ln
- 2105 Lyttleton St
- 402 Kirkwood Ln
- 403 Dicey Ford Rd
- 403 Kirkwood Ln
- 405 Kirkwood Ln
- 514 Kirkwood Ln
- 2108 Broad St
- 2108 Broad St Unit 4
- 2108 Broad St Unit 3
- 2108 Broad St Unit 2
- 2108 Broad St Unit 10
- 2108 Broad St Unit 9
- 2108 Broad St Unit 8
- 2108 Broad St Unit 6
- 2108 Broad St Unit 5
- 2108 Broad St Unit 20