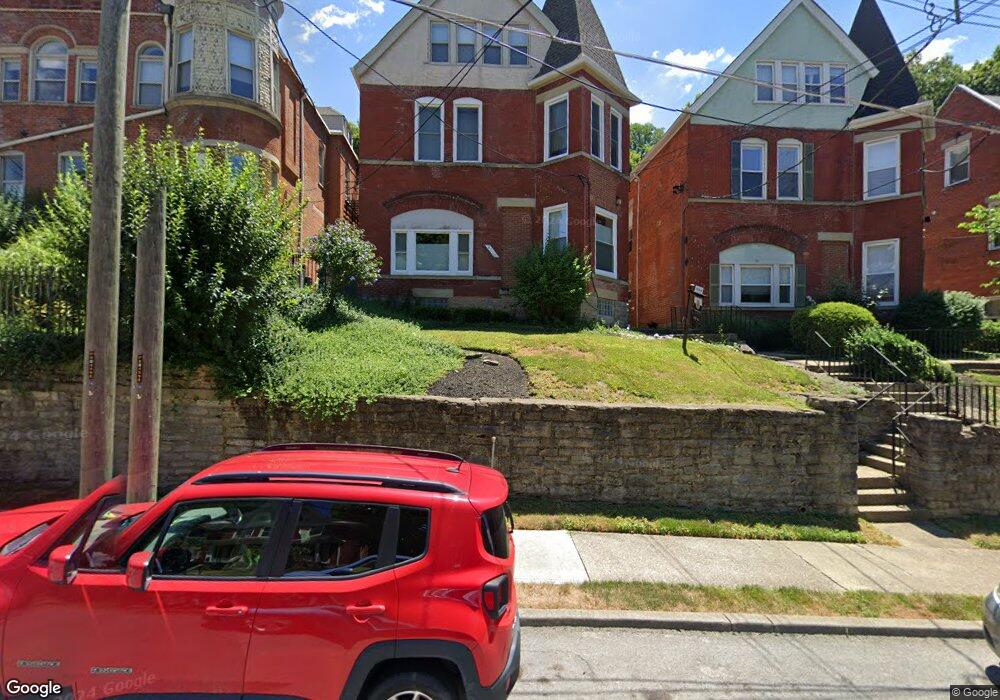
2110 Fulton Ave Unit 3 Cincinnati, OH 45206
Walnut Hills NeighborhoodEstimated Value: $138,000 - $173,000
2
Beds
1
Bath
547
Sq Ft
$289/Sq Ft
Est. Value
About This Home
This home is located at 2110 Fulton Ave Unit 3, Cincinnati, OH 45206 and is currently estimated at $158,063, approximately $288 per square foot. 2110 Fulton Ave Unit 3 is a home located in Hamilton County with nearby schools including Frederick Douglass Elementary School, Robert A. Taft Information Technology High School, and Clark Montessori High School.
Ownership History
Date
Name
Owned For
Owner Type
Purchase Details
Closed on
Sep 30, 2025
Sold by
Meador Stephen P
Bought by
Flagler April
Current Estimated Value
Purchase Details
Closed on
Mar 18, 2021
Sold by
Tampit Llc
Bought by
Meador Stephen P
Purchase Details
Closed on
Nov 19, 2020
Sold by
Meador Stephen P
Bought by
Tampit Llc
Home Financials for this Owner
Home Financials are based on the most recent Mortgage that was taken out on this home.
Original Mortgage
$111,330
Interest Rate
2.7%
Mortgage Type
New Conventional
Purchase Details
Closed on
Jun 21, 2004
Sold by
Lm Real Estate Investments Llc
Bought by
Brown Michael M and Brown Patricia
Home Financials for this Owner
Home Financials are based on the most recent Mortgage that was taken out on this home.
Original Mortgage
$88,800
Interest Rate
1.95%
Mortgage Type
Fannie Mae Freddie Mac
Create a Home Valuation Report for This Property
The Home Valuation Report is an in-depth analysis detailing your home's value as well as a comparison with similar homes in the area
Home Values in the Area
Average Home Value in this Area
Purchase History
| Date | Buyer | Sale Price | Title Company |
|---|---|---|---|
| Flagler April | $158,500 | None Listed On Document | |
| Meador Stephen P | -- | None Available | |
| Tampit Llc | -- | American Homeland Title | |
| Meador Stephen P | $123,700 | Ahta | |
| Brown Michael M | $111,000 | Custom Land Title Llc |
Source: Public Records
Mortgage History
| Date | Status | Borrower | Loan Amount |
|---|---|---|---|
| Previous Owner | Meador Stephen P | $111,330 | |
| Previous Owner | Brown Michael M | $88,800 |
Source: Public Records
Tax History Compared to Growth
Tax History
| Year | Tax Paid | Tax Assessment Tax Assessment Total Assessment is a certain percentage of the fair market value that is determined by local assessors to be the total taxable value of land and additions on the property. | Land | Improvement |
|---|---|---|---|---|
| 2024 | $2,738 | $43,295 | $7,140 | $36,155 |
| 2023 | $2,743 | $43,295 | $7,140 | $36,155 |
| 2022 | $1,881 | $26,712 | $7,140 | $19,572 |
| 2021 | $1,850 | $26,712 | $7,140 | $19,572 |
| 2020 | $1,855 | $26,712 | $7,140 | $19,572 |
| 2019 | $1,998 | $26,187 | $7,000 | $19,187 |
| 2018 | $1,998 | $26,187 | $7,000 | $19,187 |
| 2017 | $1,925 | $26,187 | $7,000 | $19,187 |
| 2016 | $2,355 | $31,262 | $7,000 | $24,262 |
| 2015 | $2,104 | $31,262 | $7,000 | $24,262 |
| 2014 | $720 | $31,262 | $7,000 | $24,262 |
| 2013 | $733 | $31,262 | $7,000 | $24,262 |
Source: Public Records
Map
Nearby Homes
- 2110 Fulton Ave
- 2114 Fulton Ave
- 2100 Fulton Ave
- 2100 Sinton Ave
- 964 Auburnview Dr
- 964 Auburnview Dr Unit 3E
- 2232 Fulton Ave
- 2106 Kemper Ln
- 967 Windsor St
- 965 Windsor St
- 2226 Kenton St
- 2019 Calvin Cliff St Unit 10
- 2191 Victory Pkwy
- 2195 Victory Pkwy
- 2199 Victory Pkwy
- 2210 Victory Pkwy
- 2356 Concord St
- 2358 Concord St
- 2362 Concord St
- 2361 Concord St
- 2110 Fulton Ave Unit D5
- 2110 Fulton Ave Unit D3
- 2110 Fulton Ave Unit D1
- 2110 Fulton Ave Unit D4
- 2110 Fulton Ave Unit D2
- 2110 Fulton Ave Unit 1
- 2110 Fulton Ave Unit 4
- 2110 Fulton Ave Unit 2
- 2110 Fulton Ave Unit 5
- 2112 Fulton Ave Unit E2
- 2112 Fulton Ave Unit E3
- 2112 Fulton Ave Unit E1
- 2112 Fulton Ave Unit E4
- 2112 Fulton Ave
- 2112 Fulton Ave Unit 4
- 2112 Fulton Ave Unit 2
- 2112 Fulton Ave Unit 3
- 2104 Fulton Ave Unit B5
- 2100 Fulton Ave Unit A4
- 2114 Fulton Ave Unit F3