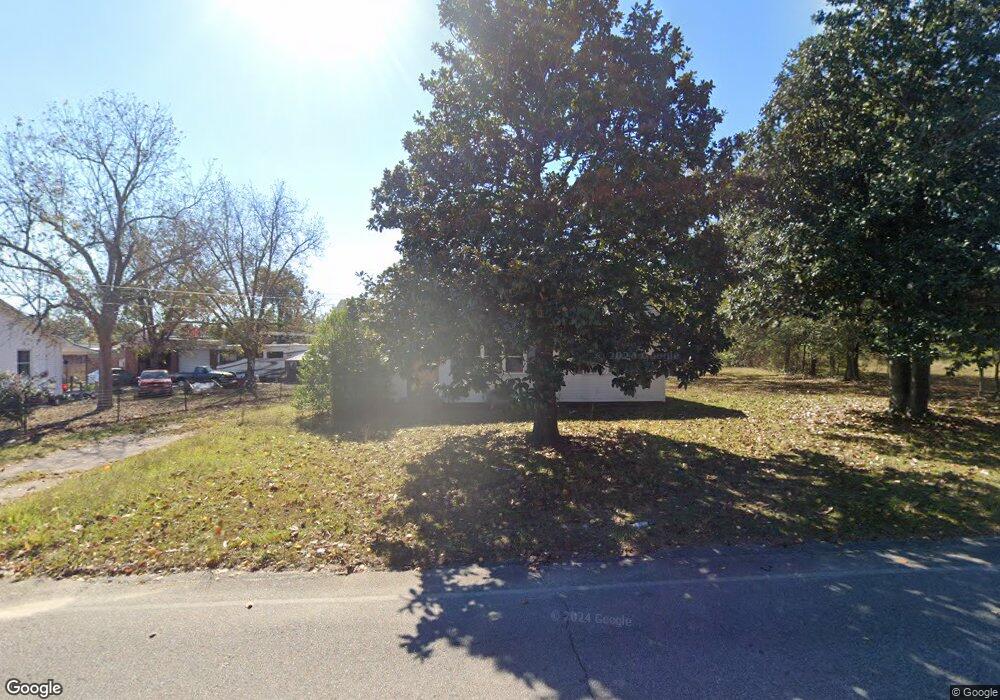
2110 Harding Rd Augusta, GA 30906
Richmond Hill NeighborhoodEstimated Value: $112,000 - $145,000
3
Beds
1
Bath
1,200
Sq Ft
$106/Sq Ft
Est. Value
About This Home
This home is located at 2110 Harding Rd, Augusta, GA 30906 and is currently estimated at $126,992, approximately $105 per square foot. 2110 Harding Rd is a home located in Richmond County with nearby schools including Wheeless Road Elementary School, Richmond Hill K-8, and Johnson Magnet.
Ownership History
Date
Name
Owned For
Owner Type
Purchase Details
Closed on
Oct 25, 2019
Sold by
Crenshaw Joseph T Sr Estate
Bought by
Morrison Richard N
Current Estimated Value
Purchase Details
Closed on
Aug 4, 2015
Sold by
Journie Pamelas
Bought by
Crenshaw Joseph T
Purchase Details
Closed on
Jan 22, 2015
Sold by
Many Professional Caregivers I
Bought by
Jowrnie Pamelas
Purchase Details
Closed on
Apr 27, 2012
Sold by
Sanders Pamela A
Bought by
Many Professional Caregivers I
Home Financials for this Owner
Home Financials are based on the most recent Mortgage that was taken out on this home.
Original Mortgage
$43,200
Interest Rate
4.01%
Mortgage Type
New Conventional
Purchase Details
Closed on
Dec 1, 1980
Sold by
May W O
Bought by
Crenshaw Joseph T
Create a Home Valuation Report for This Property
The Home Valuation Report is an in-depth analysis detailing your home's value as well as a comparison with similar homes in the area
Home Values in the Area
Average Home Value in this Area
Purchase History
| Date | Buyer | Sale Price | Title Company |
|---|---|---|---|
| Morrison Richard N | $14,000 | -- | |
| Crenshaw Joseph T | -- | -- | |
| Jowrnie Pamelas | -- | -- | |
| Many Professional Caregivers I | -- | -- | |
| Sanders Pamela A | -- | -- | |
| Sanders Pamela A | -- | -- | |
| Sanders Pamela A | -- | -- | |
| Sanders Pamela A | $56,000 | -- | |
| Sanders Pamela A | -- | -- | |
| Crenshaw Joseph T | $29,000 | -- |
Source: Public Records
Mortgage History
| Date | Status | Borrower | Loan Amount |
|---|---|---|---|
| Previous Owner | Sanders Pamela A | $43,200 |
Source: Public Records
Tax History Compared to Growth
Tax History
| Year | Tax Paid | Tax Assessment Tax Assessment Total Assessment is a certain percentage of the fair market value that is determined by local assessors to be the total taxable value of land and additions on the property. | Land | Improvement |
|---|---|---|---|---|
| 2025 | $1,316 | $37,476 | $5,600 | $31,876 |
| 2024 | $1,316 | $39,060 | $5,600 | $33,460 |
| 2023 | $1,449 | $33,868 | $5,600 | $28,268 |
| 2022 | $1,170 | $27,660 | $5,600 | $22,060 |
| 2021 | $1,155 | $24,708 | $5,600 | $19,108 |
| 2020 | $564 | $24,708 | $5,600 | $19,108 |
| 2019 | $1,195 | $24,708 | $5,600 | $19,108 |
| 2018 | $1,202 | $24,708 | $5,600 | $19,108 |
| 2017 | $1,159 | $24,708 | $5,600 | $19,108 |
| 2016 | $1,160 | $24,708 | $5,600 | $19,108 |
| 2015 | $1,167 | $24,708 | $5,600 | $19,108 |
| 2014 | $1,168 | $24,708 | $5,600 | $19,108 |
Source: Public Records
Map
Nearby Homes
- 2126 Harding Rd
- 2046 Fernwood Cir
- 2817 Fleming Dr
- 2307 Harding Rd
- 3028 Brighton St
- 2625 Blueberry Dr
- 2810 Anne St
- 2148 Eastside Ct
- 2815 Anne St
- 2816 King St
- 2813 King St
- 2208 Richards Rd
- 2820 Richmond Hill Rd
- 2144 Alfred Ln
- 2118 Sanders Rd
- 2803 King St
- 3209 Gerald Dr E
- 1825 Medlar St
- 2225 Martin Rd
- 3033 Richmond Hill Rd
- 2108 Harding Rd
- 2118 Harding Rd
- 3003 Peach Orchard Rd
- 2117 Harding Rd
- 2107 Harding Rd
- 2113 Harding Rd
- 2124 Harding Rd
- 2119 Harding Rd
- 3024 Peach Orchard Rd
- 2123 Harding Rd
- 3020 Peach
- 3020 Peach Orchard Rd
- 2041 Dunham Ct
- 2942 Peach Orchard Rd
- 2039 Dunham Ct
- 2915 Peach Orchard Rd
- 2037 Dunham Ct
- 3007 Oleta Place
- 3005 Oleta Place
- 2042 Dunham Ct