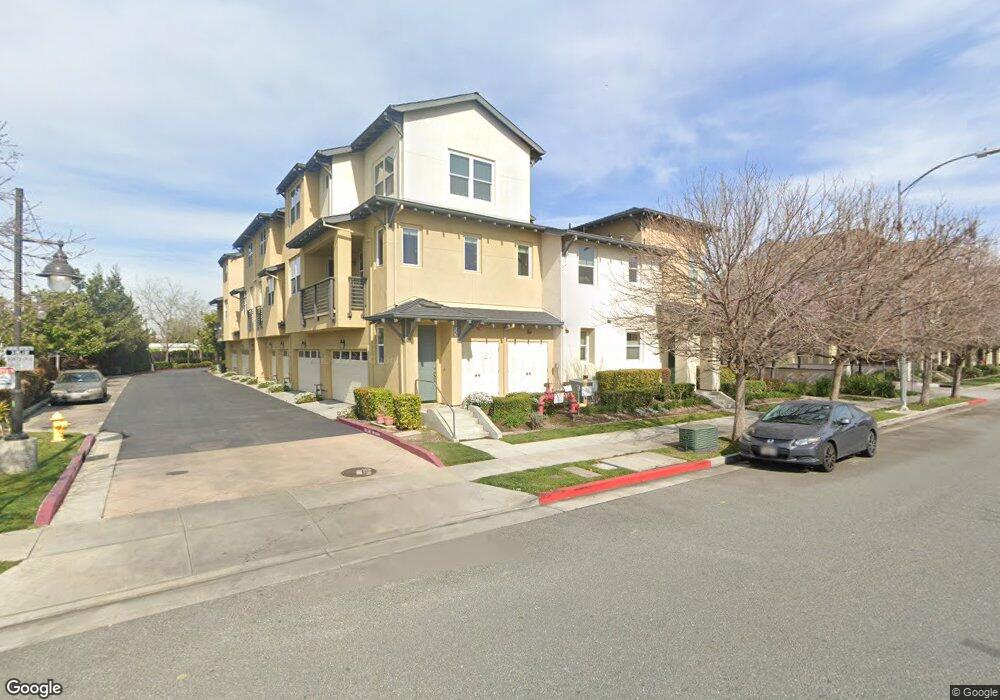
2110 Klassen Way Unit 3 San Jose, CA 95131
North San Jose NeighborhoodEstimated Value: $1,104,000 - $1,191,994
3
Beds
4
Baths
1,636
Sq Ft
$701/Sq Ft
Est. Value
About This Home
This home is located at 2110 Klassen Way Unit 3, San Jose, CA 95131 and is currently estimated at $1,147,499, approximately $701 per square foot. 2110 Klassen Way Unit 3 is a home located in Santa Clara County with nearby schools including Orchard Elementary School, Independence High School, and Walter L. Bachrodt Elementary School.
Ownership History
Date
Name
Owned For
Owner Type
Purchase Details
Closed on
May 5, 2014
Sold by
Hu Haiyan
Bought by
Hu Haiyan
Current Estimated Value
Purchase Details
Closed on
Mar 10, 2014
Sold by
Tlf Logistics Ii Silicon Valley Commerce
Bought by
Tlf Logistics Ii Silicon Valley Commerce
Purchase Details
Closed on
Jun 12, 2009
Sold by
Rock Avenue Llc
Bought by
Hu Haiyan
Home Financials for this Owner
Home Financials are based on the most recent Mortgage that was taken out on this home.
Original Mortgage
$399,000
Interest Rate
4.82%
Mortgage Type
Purchase Money Mortgage
Create a Home Valuation Report for This Property
The Home Valuation Report is an in-depth analysis detailing your home's value as well as a comparison with similar homes in the area
Home Values in the Area
Average Home Value in this Area
Purchase History
| Date | Buyer | Sale Price | Title Company |
|---|---|---|---|
| Hu Haiyan | -- | None Available | |
| Tlf Logistics Ii Silicon Valley Commerce | -- | None Available | |
| Hu Haiyan | $499,000 | Old Republic Title Company |
Source: Public Records
Mortgage History
| Date | Status | Borrower | Loan Amount |
|---|---|---|---|
| Previous Owner | Hu Haiyan | $399,000 |
Source: Public Records
Tax History Compared to Growth
Tax History
| Year | Tax Paid | Tax Assessment Tax Assessment Total Assessment is a certain percentage of the fair market value that is determined by local assessors to be the total taxable value of land and additions on the property. | Land | Improvement |
|---|---|---|---|---|
| 2025 | $8,983 | $642,430 | $321,215 | $321,215 |
| 2024 | $8,983 | $629,834 | $314,917 | $314,917 |
| 2023 | $8,983 | $617,486 | $308,743 | $308,743 |
| 2022 | $8,728 | $605,380 | $302,690 | $302,690 |
| 2021 | $8,563 | $593,510 | $296,755 | $296,755 |
| 2020 | $8,317 | $587,426 | $293,713 | $293,713 |
| 2019 | $8,145 | $575,908 | $287,954 | $287,954 |
| 2018 | $8,047 | $564,616 | $282,308 | $282,308 |
| 2017 | $7,922 | $553,546 | $276,773 | $276,773 |
| 2016 | $7,496 | $542,694 | $271,347 | $271,347 |
| 2015 | $7,445 | $534,544 | $267,272 | $267,272 |
| 2014 | $6,748 | $524,074 | $262,037 | $262,037 |
Source: Public Records
Map
Nearby Homes
- 2150 Oakland Rd
- 2151 Oakland Rd Unit 552
- 2151 Oakland Rd Unit 229
- 2151 Oakland Rd Unit 297
- 2151 Oakland Rd Unit 308
- 2151 Oakland Rd Unit 443
- 2151 Oakland Rd Unit 46
- 1819 English Bay Terrace Unit 13
- 1339 Marcello Dr
- 1836 Camino Leonor Unit 129
- 1788 Camino Leonor
- 27 S Main St
- 528 Odyssey Ln
- 374 Manzanita Ct
- 1768 Capulet Dr
- 1759 Capulet Dr
- 1068 Bigleaf Place Unit 402
- 1057 Foxglove Place Unit 202
- Plan 1 at Pinnacle
- Plan 2 at Pinnacle
- 2120 Klassen Way
- 2102 Klassen Way
- 2130 Klassen Way
- 2100 Klassen Way
- 2140 Klassen Way Unit 6
- 2150 Klassen Way Unit 7
- 2152 Klassen Way
- 1053 Rock Ave
- 2170 Klassen Way
- 2170 Klassen Way Unit 11
- 2180 Klassen Way Unit 12
- 2190 Klassen Way
- 2160 Klassen Way
- 1057 Rock Ave
- 1061 Rock Ave
- 2162 Klassen Way
- 2052 Sheffield Dr
- 1065 Rock Ave Unit 38
- 1074 Rock Ave
- 2056 Sheffield Dr Unit 43