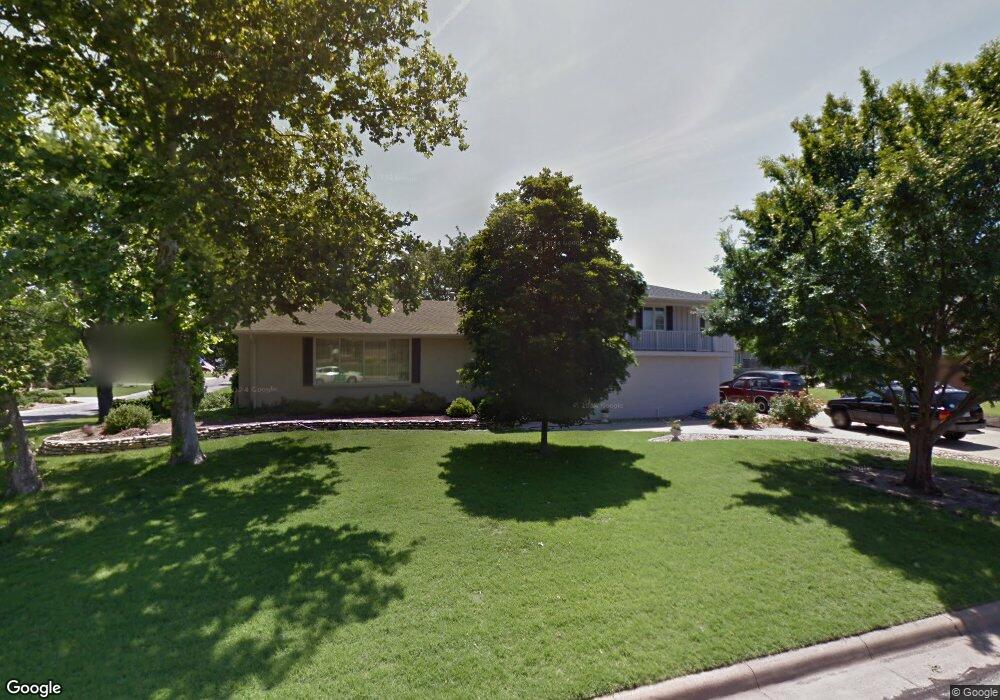
2110 Knollcrest Dr Salina, KS 67401
Estimated Value: $264,000 - $432,000
4
Beds
4
Baths
3,252
Sq Ft
$107/Sq Ft
Est. Value
About This Home
This home is located at 2110 Knollcrest Dr, Salina, KS 67401 and is currently estimated at $348,345, approximately $107 per square foot. 2110 Knollcrest Dr is a home located in Saline County with nearby schools including Meadowlark Ridge Elementary School, Lakewood Middle School, and Salina High School Central.
Ownership History
Date
Name
Owned For
Owner Type
Purchase Details
Closed on
Apr 21, 2022
Sold by
Roberta K Bengtson Trust
Bought by
Wilson Daniel C and Wilson Savannah L
Current Estimated Value
Purchase Details
Closed on
Apr 22, 2017
Sold by
Bengtson Roberta K and Bengtson Reg A
Bought by
Bengtson Greg A and Brengtson Roberta K
Home Financials for this Owner
Home Financials are based on the most recent Mortgage that was taken out on this home.
Original Mortgage
$181,000
Interest Rate
4.23%
Mortgage Type
New Conventional
Purchase Details
Closed on
Oct 26, 2010
Sold by
Bengtson Roberta K and Bengtson Greg A
Bought by
Bengtson Roberta K and Roberta K Bengtson Revocable Trust U/A D
Home Financials for this Owner
Home Financials are based on the most recent Mortgage that was taken out on this home.
Original Mortgage
$200,800
Interest Rate
4.32%
Create a Home Valuation Report for This Property
The Home Valuation Report is an in-depth analysis detailing your home's value as well as a comparison with similar homes in the area
Home Values in the Area
Average Home Value in this Area
Purchase History
| Date | Buyer | Sale Price | Title Company |
|---|---|---|---|
| Wilson Daniel C | -- | None Listed On Document | |
| Bengtson Greg A | -- | Land Title Services Inc | |
| Bengtson Roberta K | -- | Land Title Services, Inc | |
| Bengtson Roberta K | -- | Land Title Services, Inc |
Source: Public Records
Mortgage History
| Date | Status | Borrower | Loan Amount |
|---|---|---|---|
| Previous Owner | Bengtson Greg A | $181,000 | |
| Previous Owner | Bengtson Roberta K | $200,800 |
Source: Public Records
Tax History Compared to Growth
Tax History
| Year | Tax Paid | Tax Assessment Tax Assessment Total Assessment is a certain percentage of the fair market value that is determined by local assessors to be the total taxable value of land and additions on the property. | Land | Improvement |
|---|---|---|---|---|
| 2025 | $3,853 | $30,670 | $5,047 | $25,623 |
| 2024 | $3,853 | $28,922 | $5,047 | $23,875 |
| 2023 | $3,853 | $31,062 | $4,920 | $26,142 |
| 2022 | $4,174 | $31,430 | $5,479 | $25,951 |
| 2021 | $3,297 | $24,104 | $4,744 | $19,360 |
| 2020 | $3,459 | $24,978 | $4,744 | $20,234 |
| 2019 | $1,849 | $26,680 | $4,744 | $21,936 |
| 2018 | $3,748 | $27,428 | $4,744 | $22,684 |
| 2017 | $0 | $24,185 | $4,744 | $19,441 |
| 2016 | $0 | $24,279 | $3,795 | $20,484 |
| 2015 | -- | $24,449 | $3,795 | $20,654 |
| 2013 | -- | $0 | $0 | $0 |
Source: Public Records
Map
Nearby Homes
- 133 E Lake Dr
- 00000 Marymount Rd
- 403 E Park Ln
- 2413 Edgehill Rd
- 511 Aullwood Rd
- 535 Beechwood Rd
- 2390 Northwood Ln
- 2222 Brookwood Ln
- 2120 Applewood Ln
- 619 Briarcliff Rd
- 00000 Aspen Rd
- 2448 Pheasant Ln
- 10 N Eastborough Rd
- 677 Georgetown Rd
- 681 Starlight Dr
- 671 Georgetown Rd
- 649 Seitz Dr
- 16 N Eastborough Rd
- 124 S Eastmoor Dr
- 00000 Indiana Ave
- 2126 Melrose Ln
- 2111 Knollcrest Dr
- 2127 Edgehill Rd
- 2101 Melrose Ln
- 2134 Melrose Ln
- 2119 Melrose Ln
- 2100 Edgehill Rd
- 2127 Melrose Ln
- 2105 Melrose Ln
- 2135 Edgehill Rd
- 2111 Melrose Ln
- 2135 Melrose Ln
- 2142 Melrose Ln
- 2141 Edgehill Rd
- 2118 Edgehill Rd
- 2104 Edgehill Rd
- 2126 Edgehill Rd
- 118 Overhill Rd
- 2143 Melrose Ln
- 2110 Edgehill Rd