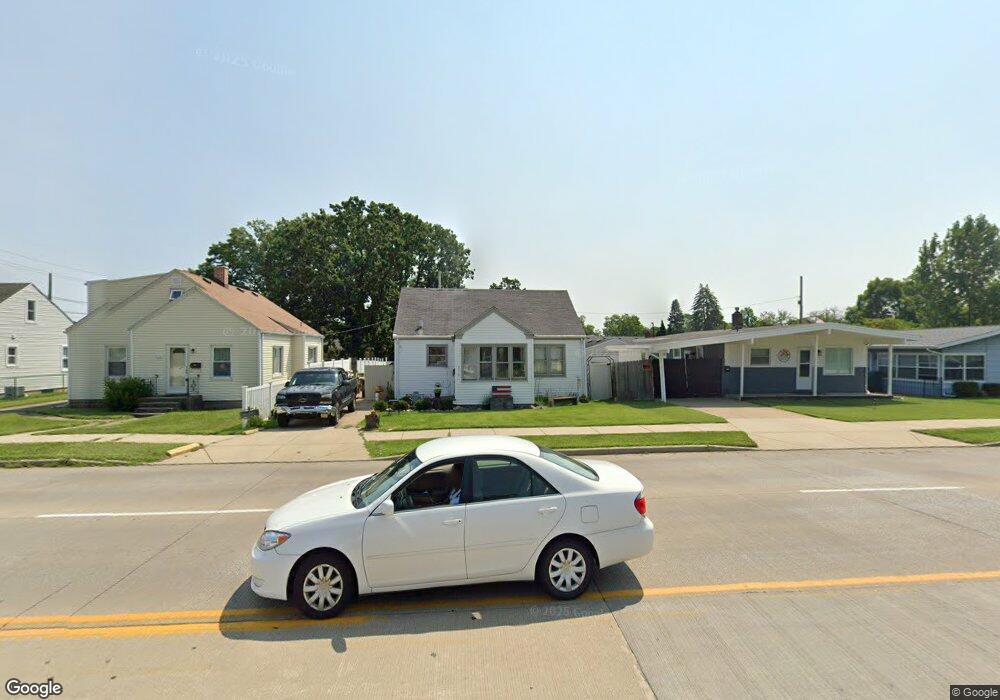
2110 N Main St Mishawaka, IN 46545
Estimated Value: $116,000 - $150,000
2
Beds
1
Bath
624
Sq Ft
$216/Sq Ft
Est. Value
About This Home
This home is located at 2110 N Main St, Mishawaka, IN 46545 and is currently estimated at $134,765, approximately $215 per square foot. 2110 N Main St is a home located in St. Joseph County with nearby schools including Liberty Elementary School, John J. Young Middle School, and Mishawaka High School.
Ownership History
Date
Name
Owned For
Owner Type
Purchase Details
Closed on
Mar 5, 2010
Sold by
Beckham Dylan and Beckham Randy
Bought by
Mcmahon Kristie
Current Estimated Value
Home Financials for this Owner
Home Financials are based on the most recent Mortgage that was taken out on this home.
Original Mortgage
$30,000
Outstanding Balance
$19,913
Interest Rate
5.01%
Mortgage Type
Purchase Money Mortgage
Estimated Equity
$114,852
Purchase Details
Closed on
Nov 5, 2009
Sold by
Gilmartin Elizabeth A and Lute Susan K
Bought by
Beckham Dylan and Beckham Randy
Create a Home Valuation Report for This Property
The Home Valuation Report is an in-depth analysis detailing your home's value as well as a comparison with similar homes in the area
Home Values in the Area
Average Home Value in this Area
Purchase History
| Date | Buyer | Sale Price | Title Company |
|---|---|---|---|
| Mcmahon Kristie | -- | Metropolitan Title In Llc | |
| Beckham Dylan | -- | Meridian Title Corp |
Source: Public Records
Mortgage History
| Date | Status | Borrower | Loan Amount |
|---|---|---|---|
| Open | Mcmahon Kristie | $30,000 |
Source: Public Records
Tax History Compared to Growth
Tax History
| Year | Tax Paid | Tax Assessment Tax Assessment Total Assessment is a certain percentage of the fair market value that is determined by local assessors to be the total taxable value of land and additions on the property. | Land | Improvement |
|---|---|---|---|---|
| 2024 | $967 | $103,600 | $20,200 | $83,400 |
| 2023 | $967 | $92,500 | $6,400 | $86,100 |
| 2022 | $786 | $83,200 | $6,400 | $76,800 |
| 2021 | $813 | $81,600 | $11,600 | $70,000 |
| 2020 | $619 | $74,200 | $10,500 | $63,700 |
| 2019 | $565 | $67,600 | $9,700 | $57,900 |
| 2018 | $542 | $64,800 | $9,300 | $55,500 |
| 2017 | $472 | $55,300 | $8,000 | $47,300 |
| 2016 | $449 | $55,300 | $8,000 | $47,300 |
| 2014 | $511 | $54,900 | $8,000 | $46,900 |
Source: Public Records
Map
Nearby Homes
- 125 E Omer Ave
- 222 E Donaldson Ave
- 135 W Leyte Ave
- 527 Imus Dr
- 807 W Lowell Ave
- 817 W Edgar Ave
- 911 N Division
- 803 N Main St
- 1702 N Merrifield Ave
- 910 W Borley Ave
- 506 W Battell St
- 501 E Lawrence St
- 721 W Broadway St
- 1719 Maplehurst Ave
- 1015 E Broadway St
- 614 W Brown Ave
- 1215 E Borley Ave
- 703 Maple St
- 910 W Lawrence St
- 3523 Sutton Dr
- 2116 N Main St
- 2106 N Main St
- 2120 N Main St
- 102 E La Salle Ave
- 112 E La Salle Ave
- 118 E La Salle Ave
- 2109 N Main St
- 122 E La Salle Ave
- 2105 N Main St
- 2123 N Main St
- 2101 N Main St
- 2020 N Main St
- 125 E Russ Ave
- 124 E La Salle Ave
- 2201 N Main St
- 115 E La Salle Ave
- 2019 N Main St
- 2205 N Main St
- 2115 Sarah St
- 117 W Russ Ave