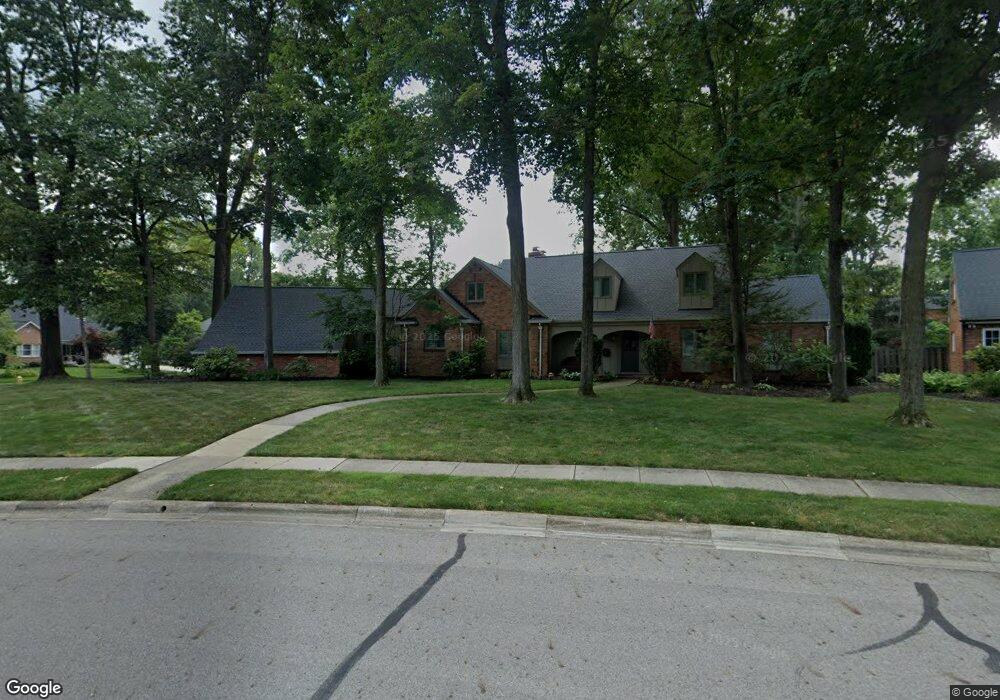
2110 Sheringham Rd Columbus, OH 43220
Estimated Value: $1,369,000 - $1,701,000
5
Beds
4
Baths
4,758
Sq Ft
$311/Sq Ft
Est. Value
About This Home
This home is located at 2110 Sheringham Rd, Columbus, OH 43220 and is currently estimated at $1,478,617, approximately $310 per square foot. 2110 Sheringham Rd is a home located in Franklin County with nearby schools including Windermere Elementary School, Hastings Middle School, and Upper Arlington High School.
Ownership History
Date
Name
Owned For
Owner Type
Purchase Details
Closed on
Jun 20, 2011
Sold by
Gerlach Andrew D and Gerlach Christy L
Bought by
Keefer Michael C and Keefer Peggy A
Current Estimated Value
Purchase Details
Closed on
Aug 15, 2000
Sold by
Travis Paul D and Travis Beverly M
Bought by
Gerlach Andrew D and Gerlach Christy L
Home Financials for this Owner
Home Financials are based on the most recent Mortgage that was taken out on this home.
Original Mortgage
$465,600
Outstanding Balance
$169,654
Interest Rate
8.29%
Estimated Equity
$1,308,963
Purchase Details
Closed on
Sep 16, 1992
Bought by
Travis Paul D
Purchase Details
Closed on
Feb 27, 1990
Purchase Details
Closed on
Feb 1, 1990
Create a Home Valuation Report for This Property
The Home Valuation Report is an in-depth analysis detailing your home's value as well as a comparison with similar homes in the area
Home Values in the Area
Average Home Value in this Area
Purchase History
| Date | Buyer | Sale Price | Title Company |
|---|---|---|---|
| Keefer Michael C | $650,000 | Title First | |
| Gerlach Andrew D | $582,000 | Chicago Title | |
| Travis Paul D | $434,300 | -- | |
| -- | $158,000 | -- | |
| -- | -- | -- |
Source: Public Records
Mortgage History
| Date | Status | Borrower | Loan Amount |
|---|---|---|---|
| Open | Gerlach Andrew D | $465,600 |
Source: Public Records
Tax History Compared to Growth
Tax History
| Year | Tax Paid | Tax Assessment Tax Assessment Total Assessment is a certain percentage of the fair market value that is determined by local assessors to be the total taxable value of land and additions on the property. | Land | Improvement |
|---|---|---|---|---|
| 2024 | $23,807 | $411,220 | $91,040 | $320,180 |
| 2023 | $23,512 | $411,220 | $91,040 | $320,180 |
| 2022 | $21,586 | $308,920 | $74,520 | $234,400 |
| 2021 | $19,109 | $308,920 | $74,520 | $234,400 |
| 2020 | $18,940 | $308,920 | $74,520 | $234,400 |
| 2019 | $17,142 | $247,210 | $74,520 | $172,690 |
| 2018 | $8,523 | $247,210 | $74,520 | $172,690 |
| 2017 | $17,011 | $247,210 | $74,520 | $172,690 |
| 2016 | $15,929 | $240,910 | $56,560 | $184,350 |
| 2015 | $7,957 | $240,910 | $56,560 | $184,350 |
| 2014 | $15,933 | $240,910 | $56,560 | $184,350 |
| 2013 | $7,824 | $225,225 | $51,415 | $173,810 |
Source: Public Records
Map
Nearby Homes
- 4115 Woodbridge Rd
- 4450 Haverford Ct
- 2060 Fontenay Place
- 2276 Johnston Rd
- 4441 Kipling Rd
- 3918 Hillview Dr
- 2276 Hoxton Ct
- 2560 Chartwell Rd
- 2300 Hoxton Ct
- 4094 Lyon Dr
- 3804 Mountview Rd
- 4781 Coach Rd
- 4720 Merrifield Place Unit 67
- 3920 Overdale Dr
- 1610 Lafayette Dr Unit 1610
- 1594 Lafayette Dr Unit 1594
- 1501 Bridgeton Dr
- 2198 Sandston Rd
- 2681 Lane Rd
- 2231 Atlee Ct Unit 12
- 4300 Waybourn Rd
- 2100 Sheringham Rd
- 2111 Sheringham Rd
- 2124 Sheringham Rd
- 4275 Waybourn Rd
- 2111 Cheltenham Rd
- 4312 Waybourn Rd
- 2090 Sheringham Rd
- 2101 Cheltenham Rd
- 4295 Waybourn Rd
- 2121 Sheringham Rd
- 2095 Sheringham Rd
- 2138 Sheringham Rd
- 4305 Waybourn Rd
- 4305 Woodbridge Rd
- 4243 Woodbridge Rd
- 4315 Waybourn Rd
- 4260 Woodhall Rd
- 4276 Woodhall Rd
- 2150 Sheringham Rd