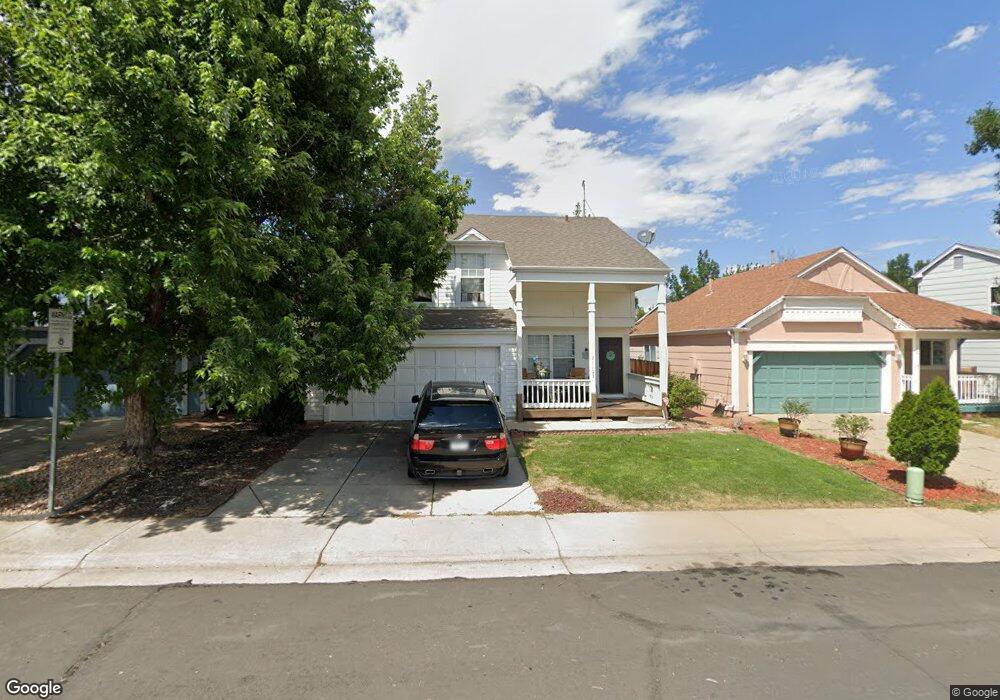
21103 E 45th Ave Denver, CO 80249
Green Valley Ranch NeighborhoodEstimated Value: $411,392 - $435,000
3
Beds
2
Baths
1,677
Sq Ft
$253/Sq Ft
Est. Value
About This Home
This home is located at 21103 E 45th Ave, Denver, CO 80249 and is currently estimated at $424,598, approximately $253 per square foot. 21103 E 45th Ave is a home located in Denver County with nearby schools including Green Valley Elementary School, Pitt-Waller K-8 School, and McGlone Academy.
Ownership History
Date
Name
Owned For
Owner Type
Purchase Details
Closed on
Apr 27, 2022
Sold by
2018-4 Ih Borrower Lp
Bought by
Sherpa Dawa
Current Estimated Value
Home Financials for this Owner
Home Financials are based on the most recent Mortgage that was taken out on this home.
Original Mortgage
$455,900
Outstanding Balance
$425,614
Interest Rate
4.16%
Mortgage Type
New Conventional
Estimated Equity
-$1,016
Purchase Details
Closed on
Jun 11, 2015
Sold by
Colfin Ai-Co 1 Llc
Bought by
Cah 2015-1 Borrower Llc
Purchase Details
Closed on
Feb 5, 2014
Sold by
Hunt Joellen Becker and Hunt Robert Berlin
Bought by
Colfin Ai Co 1 Llc
Purchase Details
Closed on
Nov 30, 2000
Sold by
Reeves Darrell J
Bought by
Hunt Joellen Becker and Hunt Robert Berlin
Home Financials for this Owner
Home Financials are based on the most recent Mortgage that was taken out on this home.
Original Mortgage
$171,223
Interest Rate
7.72%
Mortgage Type
FHA
Create a Home Valuation Report for This Property
The Home Valuation Report is an in-depth analysis detailing your home's value as well as a comparison with similar homes in the area
Home Values in the Area
Average Home Value in this Area
Purchase History
| Date | Buyer | Sale Price | Title Company |
|---|---|---|---|
| Sherpa Dawa | $470,000 | First American Title | |
| Cah 2015-1 Borrower Llc | -- | None Available | |
| Colfin Ai Co 1 Llc | $175,000 | Fidelity National Title Insu | |
| Hunt Joellen Becker | $172,400 | -- |
Source: Public Records
Mortgage History
| Date | Status | Borrower | Loan Amount |
|---|---|---|---|
| Open | Sherpa Dawa | $455,900 | |
| Previous Owner | Hunt Joellen Becker | $171,223 |
Source: Public Records
Tax History
| Year | Tax Paid | Tax Assessment Tax Assessment Total Assessment is a certain percentage of the fair market value that is determined by local assessors to be the total taxable value of land and additions on the property. | Land | Improvement |
|---|---|---|---|---|
| 2025 | $2,666 | $30,930 | $3,410 | $3,410 |
| 2024 | $2,666 | $28,270 | $3,240 | $25,030 |
| 2023 | $2,530 | $28,270 | $3,240 | $25,030 |
| 2022 | $2,321 | $23,300 | $2,680 | $20,620 |
| 2021 | $2,270 | $23,970 | $2,760 | $21,210 |
| 2020 | $2,096 | $22,230 | $2,300 | $19,930 |
| 2019 | $2,050 | $22,230 | $2,300 | $19,930 |
| 2018 | $1,783 | $18,290 | $1,860 | $16,430 |
| 2017 | $1,778 | $18,290 | $1,860 | $16,430 |
| 2016 | $1,460 | $14,360 | $1,791 | $12,569 |
| 2015 | $1,410 | $14,520 | $1,791 | $12,729 |
| 2014 | $887 | $8,600 | $2,388 | $6,212 |
Source: Public Records
Map
Nearby Homes
- 4381 Perth Cir
- 21429 E 46th Ave
- 20927 Kelly Place
- 20865 E 47th Ave
- 4315 Orleans St
- 4570 Orleans St
- 4250 Perth Cir
- 4718 Orleans St
- 21480 E 42nd Ave
- 20644 E 47th Ave
- 4312 Kirk Ct
- 4435 Picadilly Ct
- 20762 E 44th Ave
- 4116 Orleans St
- 4125 Orleans Ct
- 20655 E 49th Ave
- 4087 Orleans Ct
- 4563 N Quemoy St
- 20420 Kelly Place
- 22333 E 46th Ave
- 21113 E 45th Ave
- 21093 E 45th Ave
- 21123 E 45th Ave
- 21114 E Scott Place
- 21073 E 45th Ave
- 21124 E Scott Place
- 21134 E Scott Place
- 21104 E Scott Place
- 21143 E 45th Ave
- 21102 E 45th Ave
- 21092 E 45th Ave
- 21122 E 45th Ave
- 21053 E 45th Ave
- 21144 E Scott Place
- 21132 E 45th Ave
- 21094 E Scott Place
- 21153 E 45th Ave
- 21072 E 45th Ave
- 21142 E 45th Ave
- 21154 E Scott Place
Your Personal Tour Guide
Ask me questions while you tour the home.