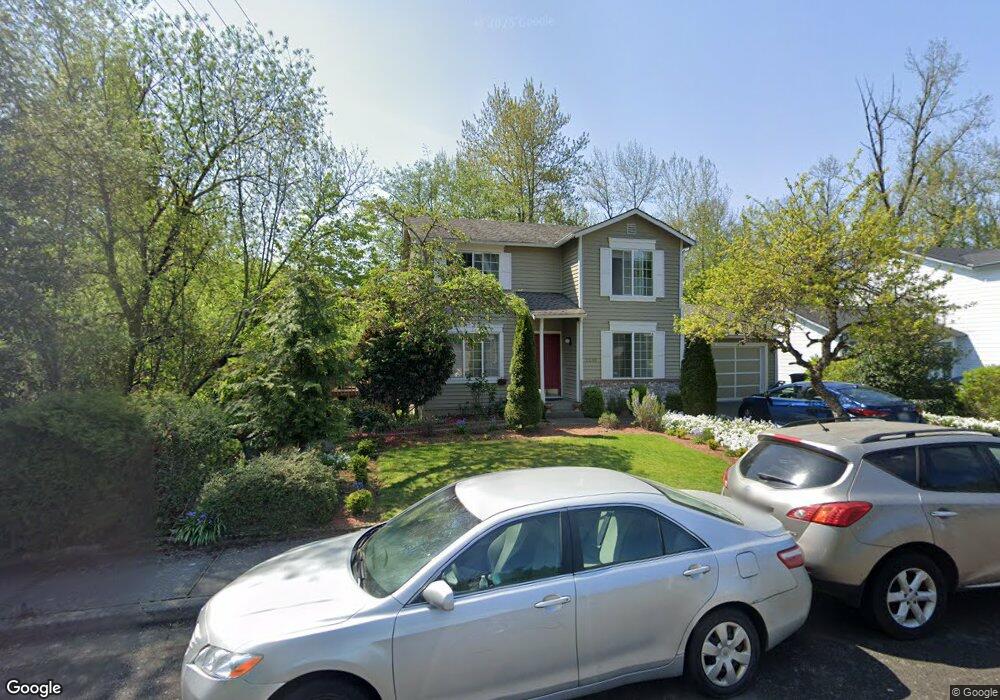
21108 23rd Ave SE Bothell, WA 98021
Canyon Park NeighborhoodEstimated Value: $970,000 - $1,003,000
4
Beds
4
Baths
1,470
Sq Ft
$672/Sq Ft
Est. Value
About This Home
This home is located at 21108 23rd Ave SE, Bothell, WA 98021 and is currently estimated at $987,417, approximately $671 per square foot. 21108 23rd Ave SE is a home located in Snohomish County with nearby schools including Canyon Creek Elementary School, Skyview Middle School, and North Creek High School.
Ownership History
Date
Name
Owned For
Owner Type
Purchase Details
Closed on
Nov 7, 2007
Sold by
Ha Susan C and Wonkyu Lee Q
Bought by
Baek Dae Hyon and Baek Kyung Ae
Current Estimated Value
Home Financials for this Owner
Home Financials are based on the most recent Mortgage that was taken out on this home.
Original Mortgage
$380,000
Outstanding Balance
$217,764
Interest Rate
4.62%
Mortgage Type
Purchase Money Mortgage
Estimated Equity
$769,653
Purchase Details
Closed on
Nov 26, 2002
Sold by
Ha Susan C and Wonkyu Lee Q
Bought by
Ha Susan C and Wonkyu Lee Q
Home Financials for this Owner
Home Financials are based on the most recent Mortgage that was taken out on this home.
Original Mortgage
$90,000
Interest Rate
5.52%
Purchase Details
Closed on
May 19, 1997
Sold by
Lee Eunha
Bought by
Lee Wonkyu
Home Financials for this Owner
Home Financials are based on the most recent Mortgage that was taken out on this home.
Original Mortgage
$129,950
Interest Rate
8.25%
Create a Home Valuation Report for This Property
The Home Valuation Report is an in-depth analysis detailing your home's value as well as a comparison with similar homes in the area
Home Values in the Area
Average Home Value in this Area
Purchase History
| Date | Buyer | Sale Price | Title Company |
|---|---|---|---|
| Baek Dae Hyon | $400,000 | Pacific Northwest Title Comp | |
| Ha Susan C | -- | Fidelity National Title | |
| Lee Wonkyu | -- | First American Title Ins Co | |
| Ha Susan C | $189,950 | -- |
Source: Public Records
Mortgage History
| Date | Status | Borrower | Loan Amount |
|---|---|---|---|
| Open | Baek Dae Hyon | $380,000 | |
| Previous Owner | Ha Susan C | $90,000 | |
| Previous Owner | Ha Susan C | $129,950 |
Source: Public Records
Tax History
| Year | Tax Paid | Tax Assessment Tax Assessment Total Assessment is a certain percentage of the fair market value that is determined by local assessors to be the total taxable value of land and additions on the property. | Land | Improvement |
|---|---|---|---|---|
| 2025 | $7,304 | $964,400 | $703,200 | $261,200 |
| 2024 | $7,304 | $869,300 | $617,500 | $251,800 |
| 2023 | $7,665 | $998,100 | $706,400 | $291,700 |
| 2022 | $6,420 | $672,500 | $424,800 | $247,700 |
| 2020 | $5,917 | $575,000 | $351,100 | $223,900 |
| 2019 | $5,162 | $519,100 | $299,800 | $219,300 |
| 2018 | $4,733 | $458,200 | $252,300 | $205,900 |
| 2017 | $3,925 | $383,200 | $206,700 | $176,500 |
| 2016 | $3,404 | $342,400 | $176,300 | $166,100 |
Source: Public Records
Map
Nearby Homes
- 1729 214th St SE
- 21708 24th Ave SE Unit A
- 20911 30th Dr SE
- 1615 208th St SE Unit 42
- 20318 Bothell Everett Hwy Unit A303
- 2115 201st Place SE Unit F4
- 2115 201st Place SE Unit K2
- 2115 201st Place SE Unit L2
- 20500 32nd Dr SE
- 1820 201st Place SE
- 2200 196th St SE Unit 25
- 2200 196th St SE Unit 66
- 2200 196th St SE Unit 76
- 2200 196th St SE Unit 30
- 2200 196th St SE Unit 70
- 20511 Greening Rd
- 3422 201st Place SE
- 22213 32nd Ave SE
- 20224 11th Dr SE
- 1216 199th St SE
- 21102 23rd Ave SE
- 2300 211th St SE
- 2301 211th St SE
- 2305 211th St SE
- 2306 211th St SE
- 2309 211th St SE
- 2312 211th St SE
- 2313 211th St SE
- 2314 211th St SE
- 21011 23rd Ave SE
- 2315 211th St SE
- 2402 211th St SE
- 2403 211th St SE
- 2302 210th St SE
- 2306 210th St SE
- 2411 211th St SE
- 2312 210th St SE
- 2405 211th St SE
- 2318 210th St SE
- 2412 211th St SE
Your Personal Tour Guide
Ask me questions while you tour the home.