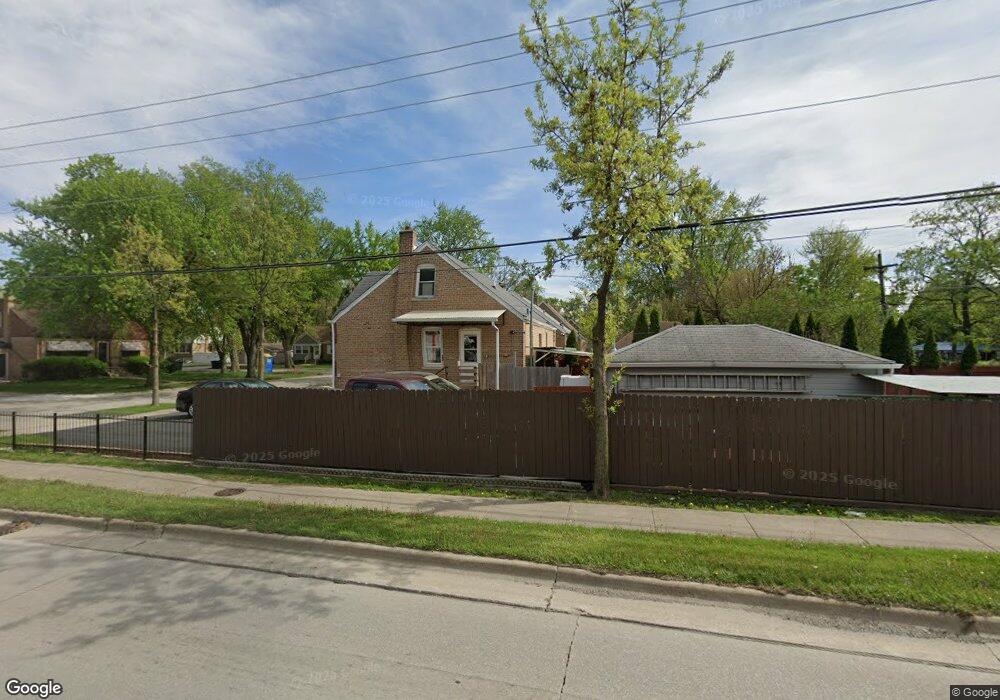
21108 Maple St Matteson, IL 60443
Old Matteson NeighborhoodEstimated Value: $141,000 - $237,000
2
Beds
1
Bath
800
Sq Ft
$223/Sq Ft
Est. Value
About This Home
This home is located at 21108 Maple St, Matteson, IL 60443 and is currently estimated at $178,459, approximately $223 per square foot. 21108 Maple St is a home located in Cook County with nearby schools including Illinois School, Matteson Elementary School, and Sauk Elementary School.
Ownership History
Date
Name
Owned For
Owner Type
Purchase Details
Closed on
Oct 30, 2006
Sold by
Elliott Dana M and Elliott June H
Bought by
Elliott Michel F
Current Estimated Value
Purchase Details
Closed on
Mar 30, 2004
Sold by
Elliott Jacob F and Elliott Breanna K
Bought by
Elliott June H and Elliott Dana M
Purchase Details
Closed on
Dec 5, 2002
Sold by
Pacius Fred J and Pacius Donna M
Bought by
Elliott Jacob F and Elliott Dana M
Home Financials for this Owner
Home Financials are based on the most recent Mortgage that was taken out on this home.
Original Mortgage
$60,900
Interest Rate
6.13%
Mortgage Type
FHA
Purchase Details
Closed on
Dec 27, 1996
Sold by
Greatbanc Trust Company
Bought by
Pacius Fred J and Henry Donna M
Home Financials for this Owner
Home Financials are based on the most recent Mortgage that was taken out on this home.
Original Mortgage
$55,000
Interest Rate
7.25%
Create a Home Valuation Report for This Property
The Home Valuation Report is an in-depth analysis detailing your home's value as well as a comparison with similar homes in the area
Home Values in the Area
Average Home Value in this Area
Purchase History
| Date | Buyer | Sale Price | Title Company |
|---|---|---|---|
| Elliott Michel F | -- | None Available | |
| Elliott June H | -- | -- | |
| Elliott Jacob F | $87,000 | -- | |
| Pacius Fred J | $62,000 | -- |
Source: Public Records
Mortgage History
| Date | Status | Borrower | Loan Amount |
|---|---|---|---|
| Previous Owner | Elliott Jacob F | $60,900 | |
| Previous Owner | Pacius Fred J | $55,000 |
Source: Public Records
Tax History
| Year | Tax Paid | Tax Assessment Tax Assessment Total Assessment is a certain percentage of the fair market value that is determined by local assessors to be the total taxable value of land and additions on the property. | Land | Improvement |
|---|---|---|---|---|
| 2025 | $3,320 | $14,000 | $3,089 | $10,911 |
| 2024 | $3,320 | $14,000 | $3,089 | $10,911 |
| 2023 | $728 | $14,000 | $3,089 | $10,911 |
| 2022 | $728 | $7,498 | $2,703 | $4,795 |
| 2021 | $827 | $7,498 | $2,703 | $4,795 |
| 2020 | $975 | $7,498 | $2,703 | $4,795 |
| 2019 | $3,100 | $9,418 | $2,509 | $6,909 |
| 2018 | $3,096 | $9,418 | $2,509 | $6,909 |
| 2017 | $3,002 | $9,418 | $2,509 | $6,909 |
| 2016 | $2,998 | $8,595 | $2,316 | $6,279 |
| 2015 | $2,911 | $8,595 | $2,316 | $6,279 |
| 2014 | $2,846 | $8,595 | $2,316 | $6,279 |
| 2013 | $3,184 | $10,007 | $2,316 | $7,691 |
Source: Public Records
Map
Nearby Homes
- 21142 Locust St
- 3919 214th St
- 21406 S Jean Ave
- 3727 214th Place Unit 2
- 831 Violet Ln
- 3704 215th St Unit 105
- 3704 215th St Unit 205
- 3809 215th St
- 3421 Station Dr
- 4110 Applewood Ln
- 20920 Governors Hwy
- 3135 Nottingham Ct
- 3133 Nottingham Ct
- 120 Indiana St
- 126 Indiana St
- 4052 Charleston Rd
- 20535 Marathon Ct
- 500 Antietam St
- 21616 Richmond Rd
- 442 Homan Ave
- 21112 Maple St
- 21116 Maple St
- 21109 Maple St
- 21120 Maple St
- 1044 Elliot Ct
- 3722 211th Place
- 21126 Maple St
- 3727 211th Place
- 21132 Maple St
- 21127 Maple St
- 1050 Elliot Ct
- 1045 Wingate Rd
- 3719 211th Place
- 3714 211th Place
- 21136 Maple St
- 21133 Maple St
- 3715 211th Place
- 1038 Elliot Ct
- 3710 211th Place
- 21140 Maple St
Your Personal Tour Guide
Ask me questions while you tour the home.