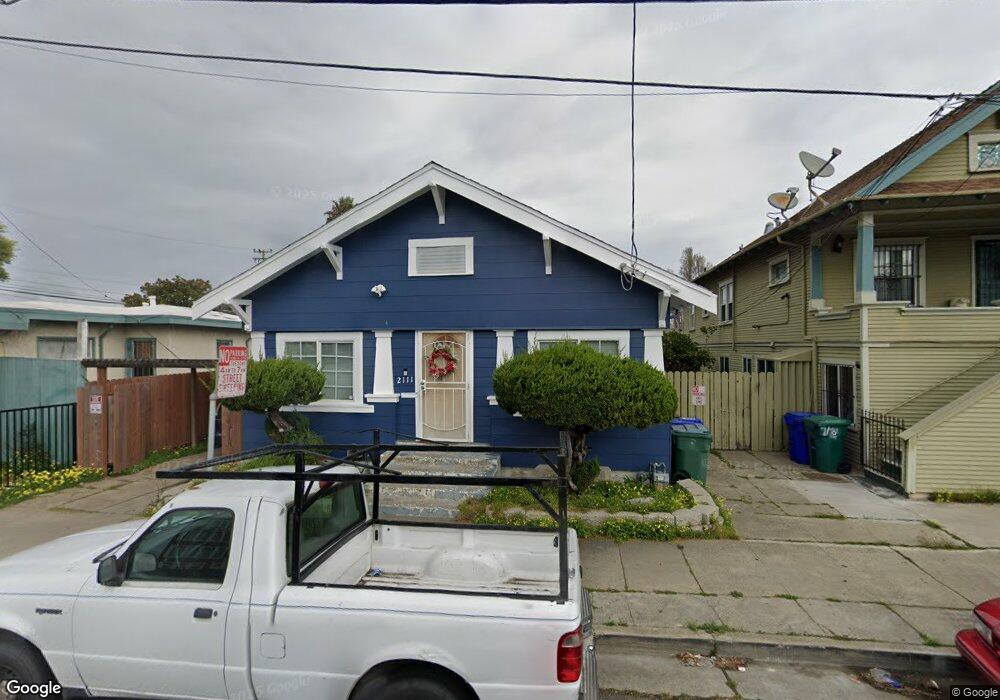
2111 Barrett Ave Richmond, CA 94801
Belding Woods NeighborhoodEstimated Value: $537,892 - $655,000
3
Beds
2
Baths
1,153
Sq Ft
$508/Sq Ft
Est. Value
About This Home
This home is located at 2111 Barrett Ave, Richmond, CA 94801 and is currently estimated at $586,223, approximately $508 per square foot. 2111 Barrett Ave is a home located in Contra Costa County with nearby schools including Grant Elementary School, Lovonya DeJean Middle School, and John F. Kennedy High School.
Ownership History
Date
Name
Owned For
Owner Type
Purchase Details
Closed on
Aug 20, 2020
Sold by
Jameson Valerie V and Pacheco Luis A
Bought by
Jameson Valerie V
Current Estimated Value
Purchase Details
Closed on
Mar 29, 2017
Sold by
Wong Yim Ho and Wong Angela
Bought by
Jameson Valerie V and Pacheco Luis A
Home Financials for this Owner
Home Financials are based on the most recent Mortgage that was taken out on this home.
Original Mortgage
$342,000
Interest Rate
4.15%
Mortgage Type
New Conventional
Purchase Details
Closed on
Feb 22, 2003
Sold by
Wong Chun Yu
Bought by
Wong Yim Ho and Wong Angela
Purchase Details
Closed on
Jul 6, 1996
Sold by
Wong Chui Kuen and Wong Im Hong
Bought by
Wong Chui Kuen
Purchase Details
Closed on
Apr 5, 1996
Sold by
Wong Yim Ho and Li Hui Ling
Bought by
Wong Chun Yu
Create a Home Valuation Report for This Property
The Home Valuation Report is an in-depth analysis detailing your home's value as well as a comparison with similar homes in the area
Home Values in the Area
Average Home Value in this Area
Purchase History
| Date | Buyer | Sale Price | Title Company |
|---|---|---|---|
| Jameson Valerie V | -- | Old Republic Title Company | |
| Jameson Valerie V | $396,000 | Old Republic Title Company | |
| Wong Yim Ho | -- | -- | |
| Wong Chui Kuen | -- | -- | |
| Wong Chui Kuen | -- | -- | |
| Wong Chun Yu | -- | -- |
Source: Public Records
Mortgage History
| Date | Status | Borrower | Loan Amount |
|---|---|---|---|
| Previous Owner | Jameson Valerie V | $342,000 |
Source: Public Records
Tax History Compared to Growth
Tax History
| Year | Tax Paid | Tax Assessment Tax Assessment Total Assessment is a certain percentage of the fair market value that is determined by local assessors to be the total taxable value of land and additions on the property. | Land | Improvement |
|---|---|---|---|---|
| 2025 | $7,797 | $459,807 | $369,821 | $89,986 |
| 2024 | $7,695 | $450,792 | $362,570 | $88,222 |
| 2023 | $7,695 | $441,954 | $355,461 | $86,493 |
| 2022 | $7,632 | $433,290 | $348,492 | $84,798 |
| 2021 | $7,553 | $424,590 | $343,318 | $81,272 |
| 2019 | $7,100 | $411,998 | $333,136 | $78,862 |
| 2018 | $6,853 | $403,920 | $326,604 | $77,316 |
| 2017 | $3,708 | $189,595 | $60,914 | $128,681 |
| 2016 | $3,622 | $185,878 | $59,720 | $126,158 |
| 2015 | $3,582 | $183,086 | $58,823 | $124,263 |
| 2014 | $3,061 | $146,000 | $46,908 | $99,092 |
Source: Public Records
Map
Nearby Homes