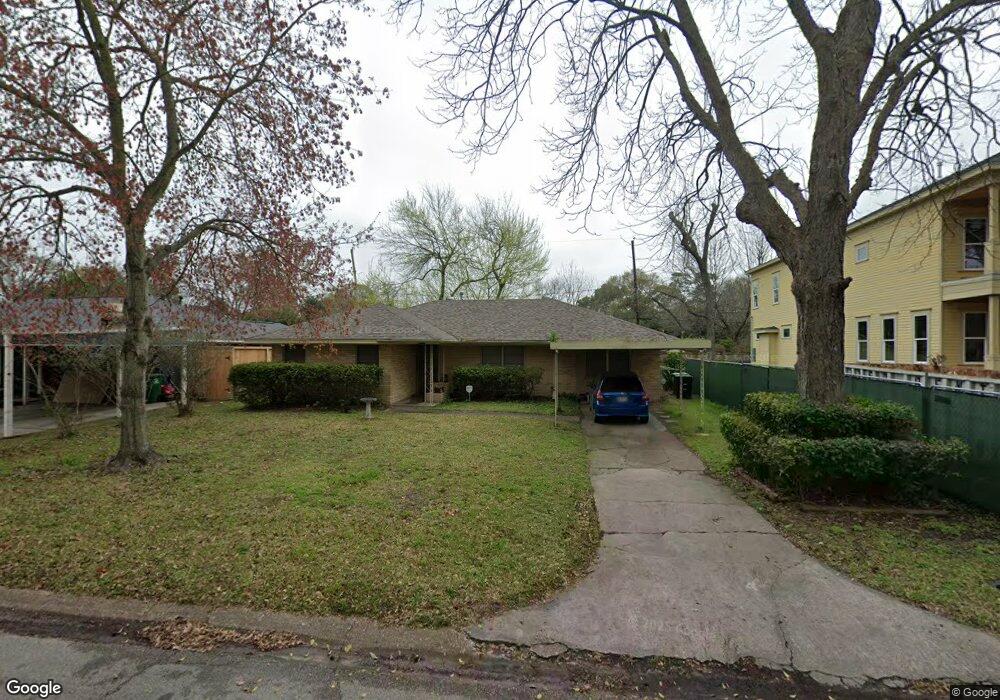
2111 Cheshire Ln Houston, TX 77018
Oak Forest-Garden Oaks NeighborhoodEstimated Value: $440,599 - $708,000
3
Beds
1
Bath
1,586
Sq Ft
$332/Sq Ft
Est. Value
About This Home
This home is located at 2111 Cheshire Ln, Houston, TX 77018 and is currently estimated at $526,900, approximately $332 per square foot. 2111 Cheshire Ln is a home located in Harris County with nearby schools including Stevens Elementary School, Frank Black Middle School, and Waltrip High School.
Ownership History
Date
Name
Owned For
Owner Type
Purchase Details
Closed on
Nov 29, 2016
Sold by
Sisson Thomas Murray
Bought by
Lozano Miguel Angel
Current Estimated Value
Home Financials for this Owner
Home Financials are based on the most recent Mortgage that was taken out on this home.
Original Mortgage
$114,475
Outstanding Balance
$55,098
Interest Rate
3.52%
Mortgage Type
New Conventional
Estimated Equity
$471,802
Purchase Details
Closed on
Jun 2, 2005
Sold by
Mclehany Troy
Bought by
Gallardo Edward M and Gallardo Barrie White
Purchase Details
Closed on
Feb 17, 2005
Sold by
Gallardo Edward M and Gallardo Barrie White
Bought by
Mclehany Troy
Purchase Details
Closed on
Nov 27, 1996
Sold by
Nichols Rosemary and Neither Joyce Wolter
Bought by
Gallardo Edward M and Gallardo Barrie White
Home Financials for this Owner
Home Financials are based on the most recent Mortgage that was taken out on this home.
Original Mortgage
$46,000
Interest Rate
7.85%
Create a Home Valuation Report for This Property
The Home Valuation Report is an in-depth analysis detailing your home's value as well as a comparison with similar homes in the area
Home Values in the Area
Average Home Value in this Area
Purchase History
| Date | Buyer | Sale Price | Title Company |
|---|---|---|---|
| Lozano Miguel Angel | -- | Texas American Title Co | |
| Gallardo Edward M | -- | -- | |
| Mclehany Troy | -- | -- | |
| Gallardo Edward M | -- | Commonwealth Title |
Source: Public Records
Mortgage History
| Date | Status | Borrower | Loan Amount |
|---|---|---|---|
| Open | Lozano Miguel Angel | $114,475 | |
| Previous Owner | Gallardo Edward M | $46,000 |
Source: Public Records
Tax History Compared to Growth
Tax History
| Year | Tax Paid | Tax Assessment Tax Assessment Total Assessment is a certain percentage of the fair market value that is determined by local assessors to be the total taxable value of land and additions on the property. | Land | Improvement |
|---|---|---|---|---|
| 2025 | $5,780 | $430,000 | $390,000 | $40,000 |
| 2024 | $5,780 | $396,487 | $367,500 | $28,987 |
| 2023 | $5,780 | $402,048 | $367,500 | $34,548 |
| 2022 | $7,328 | $373,283 | $322,500 | $50,783 |
| 2021 | $7,052 | $302,556 | $277,500 | $25,056 |
| 2020 | $8,092 | $334,151 | $277,500 | $56,651 |
| 2019 | $7,897 | $319,000 | $277,500 | $41,500 |
| 2018 | $5,470 | $283,707 | $225,000 | $58,707 |
| 2017 | $6,762 | $314,596 | $225,000 | $89,596 |
| 2016 | $6,147 | $314,596 | $225,000 | $89,596 |
| 2015 | $3,974 | $314,596 | $225,000 | $89,596 |
| 2014 | $3,974 | $232,283 | $142,500 | $89,783 |
Source: Public Records
Map
Nearby Homes
- 2118 Cheshire Ln
- 2202 Hewitt Dr
- 2007 Hewitt Dr
- 2211 Libbey Dr
- 2214 Hewitt Dr
- 2114 Saxon Dr
- 2302 Hewitt Dr
- 2111 Nina Lee Ln
- 2019 Saxon Dr
- 2106 Nina Lee Ln
- 2211 Saxon Dr
- 2007 Lamonte Ln
- 2311 Saxon Dr
- 1918 Gardenia Dr
- 4218 T C Jester Blvd
- 2103 Brimberry St
- 1818 Nina Lee Ln
- 2314 Hialeah Dr
- 2318 Hialeah Dr
- 1730 Chantilly Ln
- 2107 Cheshire Ln
- 2115 Cheshire Ln
- 2110 Chantilly Ln
- 2114 Chantilly Ln
- 2103 Cheshire Ln
- 2119 Cheshire Ln
- 2106 Chantilly Ln
- 2118 Chantilly Ln
- 2110 Cheshire Ln
- 2102 Chantilly Ln
- 2114 Cheshire Ln
- 2123 Cheshire Ln
- 2106 Cheshire Ln
- 2122 Chantilly Ln
- 2102 Cheshire Ln
- 2030 Chantilly Ln
- 2122 Cheshire Ln
- 2126 Chantilly Ln
- 2027 Cheshire Ln
- 2127 Cheshire Ln