2111 Clover Ln Champaign, IL 61821
West Haven NeighborhoodEstimated Value: $189,000 - $231,000
Studio
2
Baths
1,388
Sq Ft
$156/Sq Ft
Est. Value
About This Home
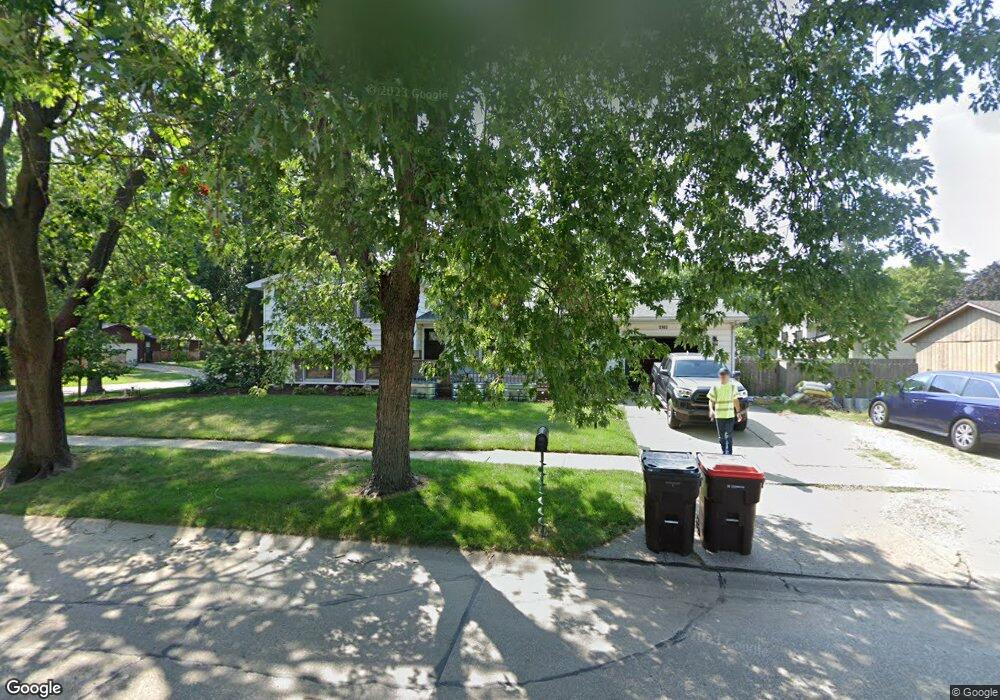
This home is located at 2111 Clover Ln, Champaign, IL 61821 and is currently estimated at $216,125, approximately $155 per square foot. 2111 Clover Ln is a home located in Champaign County with nearby schools including Centennial High School, Next Generation School, and St. Matthew School.
Ownership History
Date
Name
Owned For
Owner Type
Purchase Details
Closed on
Mar 13, 2019
Sold by
Welch Ann and Welch Ricky L
Bought by
Welch Ann V
Current Estimated Value
Purchase Details
Closed on
May 8, 2017
Sold by
Welch Ann V
Bought by
Welch Ann V and Welch Ricky L
Purchase Details
Closed on
Jul 29, 2008
Sold by
Woods Muncher Morden and Woods Randa Kay
Bought by
Welch Ann V
Home Financials for this Owner
Home Financials are based on the most recent Mortgage that was taken out on this home.
Original Mortgage
$144,952
Outstanding Balance
$92,693
Interest Rate
6.5%
Mortgage Type
FHA
Estimated Equity
$123,432
Purchase Details
Closed on
Feb 4, 2004
Sold by
Stout Charles E and Stout Janet L
Bought by
Woods Muncher Morden and Woods Randa Kay
Home Financials for this Owner
Home Financials are based on the most recent Mortgage that was taken out on this home.
Original Mortgage
$108,000
Interest Rate
5.88%
Mortgage Type
Unknown
Create a Home Valuation Report for This Property
The Home Valuation Report is an in-depth analysis detailing your home's value as well as a comparison with similar homes in the area
Home Values in the Area
Average Home Value in this Area
Purchase History
| Date | Buyer | Sale Price | Title Company |
|---|---|---|---|
| Welch Ann V | -- | Attorney | |
| Welch Ann V | -- | None Available | |
| Welch Ann V | $147,000 | None Available | |
| Woods Muncher Morden | $135,000 | -- |
Source: Public Records
Mortgage History
| Date | Status | Borrower | Loan Amount |
|---|---|---|---|
| Open | Welch Ann V | $144,952 | |
| Previous Owner | Woods Muncher Morden | $108,000 |
Source: Public Records
Tax History
| Year | Tax Paid | Tax Assessment Tax Assessment Total Assessment is a certain percentage of the fair market value that is determined by local assessors to be the total taxable value of land and additions on the property. | Land | Improvement |
|---|---|---|---|---|
| 2025 | $4,616 | $66,120 | $20,790 | $45,330 |
| 2024 | $4,299 | $58,930 | $18,530 | $40,400 |
| 2023 | $4,299 | $53,670 | $16,880 | $36,790 |
| 2022 | $4,001 | $49,510 | $15,570 | $33,940 |
| 2021 | $4,443 | $48,530 | $15,260 | $33,270 |
| 2020 | $3,728 | $46,660 | $14,670 | $31,990 |
| 2019 | $4,201 | $52,370 | $14,370 | $38,000 |
| 2018 | $4,098 | $51,540 | $14,140 | $37,400 |
| 2017 | $4,115 | $51,540 | $14,140 | $37,400 |
| 2016 | $3,679 | $50,480 | $13,850 | $36,630 |
| 2015 | $3,698 | $49,580 | $13,600 | $35,980 |
| 2014 | $3,666 | $49,580 | $13,600 | $35,980 |
| 2013 | $3,633 | $49,580 | $13,600 | $35,980 |
Source: Public Records
Map
Nearby Homes
- 2106 Sumac Dr
- 2005 Clover Ct E
- 2210 Winchester Dr
- 1901 Blackthorn Dr
- 1937 Blackthorn Dr Unit 43
- 2307 Branch Rd
- 2014 Blackthorn Dr Unit 13
- 2314 Aspen Dr
- 2130 Ivy Ct
- 2111 Sunview Dr
- 2501 Jordan Dr
- 2205 Southmoor Dr
- 2001 S Mattis Ave Unit E
- 2159 Harbortown Cir Unit 2159
- 1813 Winchester Dr
- 2317 Brookshire E
- 2406 Cherry Hills Dr
- 2204 Edgewater Place
- 2402 Windward Blvd Unit 209
- 2205 Edgewater Place
- 2111 Clover Ct W
- 2109 Clover Ct W
- 2308 Winchester Dr
- 2110 Clover Ct W
- 2304 Winchester Dr
- 2110 Sumac Dr
- 2107 Clover Ct W
- 2108 Clover Ct W
- 2114 Sumac Dr
- 2302 Winchester Dr
- 2108 Sumac Dr
- 2105 Clover Ct W
- 2106 Clover Ct W
- 2109 Branch Rd
- 2111 Branch Rd
- 2107 Branch Rd
- 2303 Winchester Dr
- 2214 Winchester Dr
- 2103 Clover Ct W
- 2103 Clover Ct W
Your Personal Tour Guide
Ask me questions while you tour the home.