2111 Grant St Berkeley, CA 94703
Downtown Berkeley NeighborhoodEstimated Value: $1,244,000 - $1,910,000
3
Beds
2
Baths
1,690
Sq Ft
$939/Sq Ft
Est. Value
About This Home
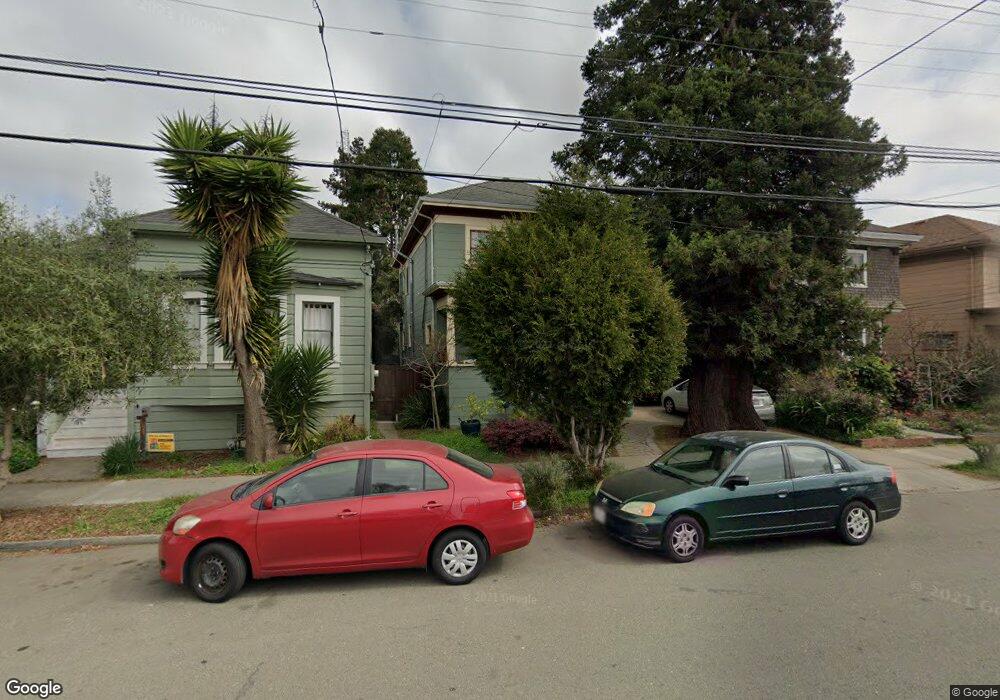
This home is located at 2111 Grant St, Berkeley, CA 94703 and is currently estimated at $1,587,306, approximately $939 per square foot. 2111 Grant St is a home located in Alameda County with nearby schools including Washington Elementary School, Berkeley Arts Magnet at Whittier School, and Oxford Elementary School.
Ownership History
Date
Name
Owned For
Owner Type
Purchase Details
Closed on
Apr 29, 2016
Sold by
Duflon Andrea and Sheridan John
Bought by
Simon Richard and Bakajin Olgica
Current Estimated Value
Home Financials for this Owner
Home Financials are based on the most recent Mortgage that was taken out on this home.
Original Mortgage
$1,020,000
Outstanding Balance
$813,311
Interest Rate
3.71%
Mortgage Type
New Conventional
Estimated Equity
$773,995
Purchase Details
Closed on
Jan 21, 2015
Sold by
Duflon Andrea and Sheridan John
Bought by
Duflon Andrea and Sheridan John
Home Financials for this Owner
Home Financials are based on the most recent Mortgage that was taken out on this home.
Original Mortgage
$100,000
Interest Rate
3.75%
Mortgage Type
Credit Line Revolving
Purchase Details
Closed on
Jun 27, 2011
Sold by
Duflon Andrea
Bought by
Duflon Andrea and Sheridan John
Create a Home Valuation Report for This Property
The Home Valuation Report is an in-depth analysis detailing your home's value as well as a comparison with similar homes in the area
Home Values in the Area
Average Home Value in this Area
Purchase History
| Date | Buyer | Sale Price | Title Company |
|---|---|---|---|
| Simon Richard | $1,275,000 | Old Republic Title Co Montcl | |
| Duflon Andrea | -- | Lawyers Title | |
| Duflon Andrea | -- | None Available |
Source: Public Records
Mortgage History
| Date | Status | Borrower | Loan Amount |
|---|---|---|---|
| Open | Simon Richard | $1,020,000 | |
| Previous Owner | Duflon Andrea | $100,000 |
Source: Public Records
Tax History
| Year | Tax Paid | Tax Assessment Tax Assessment Total Assessment is a certain percentage of the fair market value that is determined by local assessors to be the total taxable value of land and additions on the property. | Land | Improvement |
|---|---|---|---|---|
| 2025 | $23,454 | $1,517,097 | $532,696 | $991,401 |
| 2024 | $23,454 | $1,487,215 | $522,252 | $971,963 |
| 2023 | $23,132 | $1,464,924 | $512,014 | $952,910 |
| 2022 | $21,695 | $1,429,200 | $501,975 | $934,225 |
| 2021 | $21,774 | $1,401,042 | $492,133 | $915,909 |
| 2020 | $20,834 | $1,393,610 | $487,089 | $906,521 |
| 2019 | $20,175 | $1,366,290 | $477,540 | $888,750 |
| 2018 | $19,840 | $1,339,510 | $468,180 | $871,330 |
| 2017 | $19,595 | $1,300,500 | $459,000 | $841,500 |
| 2016 | $4,305 | $166,954 | $135,252 | $31,702 |
| 2015 | $4,220 | $164,447 | $133,221 | $31,226 |
| 2014 | $4,179 | $161,227 | $130,612 | $30,615 |
Source: Public Records
Map
Nearby Homes
- 2218 -2222 Grant St
- 2118 California St
- 1813 Sacramento St
- 1625 Martin Luther King jr Way
- 1436 Delaware St
- 1808 Cedar St
- 1645 Dwight Way
- 1411 Hearst Ave Unit 2
- 1609 Bonita Ave Unit 5
- 1610 Milvia St
- 2350 Sacramento St
- 1901 Parker St Unit 3
- 2018 Blake St
- 1682 Oxford St
- 1564 Sacramento St
- 2201 Virginia St Unit 2
- 1739 Spruce St
- 1815 Vine St
- 1612 Parker St
- 1425 Martin Luther King jr Way
- 2115 Grant St
- 2107 Grant St
- 2117 Grant St
- 1806 Addison St
- 1808 Addison St
- 2119 Grant St
- 1810 Addison St
- 2112 Mckinley Ave Unit D
- 2112 Mckinley Ave Unit C
- 2112 Mckinley Ave Unit B
- 2112 Mckinley Ave Unit A
- 2114 Mckinley Ave
- 2118 Mckinley Ave
- 2127 Grant St
- 2110 Mckinley Ave
- 1746 Addison St
- 2108 Grant St
- 2112 Grant St
- 1744 Addison St
- 2100 Mckinley Ave
Your Personal Tour Guide
Ask me questions while you tour the home.