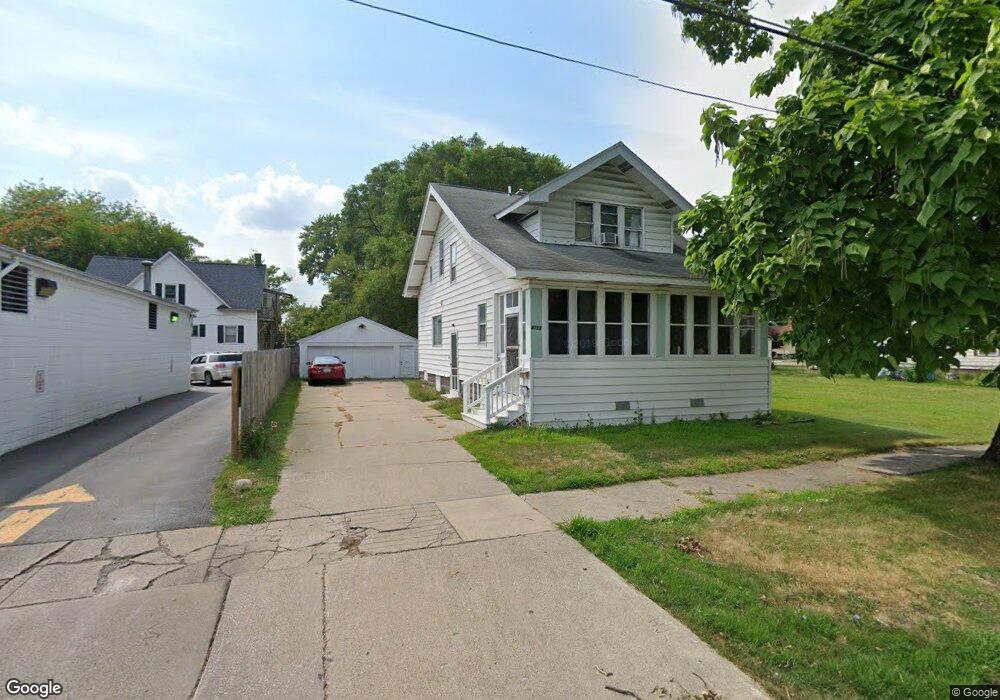
2111 N Bond St Saginaw, MI 48602
Covenant NeighborhoodEstimated Value: $69,657 - $84,000
--
Bed
1
Bath
1,246
Sq Ft
$62/Sq Ft
Est. Value
About This Home
This home is located at 2111 N Bond St, Saginaw, MI 48602 and is currently estimated at $77,414, approximately $62 per square foot. 2111 N Bond St is a home located in Saginaw County with nearby schools including Stone School, Thompson Middle School, and Arthur Hill High School.
Ownership History
Date
Name
Owned For
Owner Type
Purchase Details
Closed on
Dec 6, 2021
Sold by
Hesse Carl R and Barbarahese Trust No I
Bought by
Hesse Carl R
Current Estimated Value
Purchase Details
Closed on
Sep 11, 2020
Sold by
Hesse Barbara A
Bought by
Hesse Barbara and Barbara Hesse Trust
Purchase Details
Closed on
Nov 2, 2002
Sold by
Dole Lori L
Bought by
Hesse Barbara A
Purchase Details
Closed on
Nov 1, 2002
Sold by
Salget Gerald D and Salget Barbara J
Bought by
Dole Lori L
Purchase Details
Closed on
Dec 19, 1988
Sold by
Lurins Joseph Est
Bought by
Salget Gerald D and Barbara Jean
Purchase Details
Closed on
Apr 1, 1981
Purchase Details
Closed on
Nov 1, 1980
Sold by
Lurins Construction Co Inc
Bought by
Joe Lurins Builders Inc
Purchase Details
Closed on
Jun 29, 1979
Sold by
Lurins Joseph
Bought by
Lurins Construction Co Inc
Purchase Details
Closed on
May 11, 1979
Sold by
Clark Vincent J and Clark Florence E
Bought by
Lurins Joseph
Purchase Details
Closed on
Apr 11, 1979
Sold by
Clark Florence E and Clark Robert E
Bought by
Clark Vincent J and Clark Florence E
Create a Home Valuation Report for This Property
The Home Valuation Report is an in-depth analysis detailing your home's value as well as a comparison with similar homes in the area
Home Values in the Area
Average Home Value in this Area
Purchase History
| Date | Buyer | Sale Price | Title Company |
|---|---|---|---|
| Hesse Carl R | -- | None Available | |
| Hesse Barbara | -- | None Available | |
| Hesse Barbara A | $67,000 | -- | |
| Dole Lori L | -- | -- | |
| Hessee Barbara A | $67,000 | -- | |
| Salget Gerald D | $38,000 | -- | |
| -- | $42,500 | -- | |
| Joe Lurins Builders Inc | -- | -- | |
| Lurins Construction Co Inc | $9,300 | -- | |
| Lurins Joseph | $42,000 | -- | |
| Clark Vincent J | -- | -- |
Source: Public Records
Tax History Compared to Growth
Tax History
| Year | Tax Paid | Tax Assessment Tax Assessment Total Assessment is a certain percentage of the fair market value that is determined by local assessors to be the total taxable value of land and additions on the property. | Land | Improvement |
|---|---|---|---|---|
| 2025 | $1,443 | $30,100 | $0 | $0 |
| 2024 | $1,180 | $28,200 | $0 | $0 |
| 2023 | $1,133 | $24,300 | $0 | $0 |
| 2022 | $1,324 | $21,100 | $0 | $0 |
| 2021 | $1,246 | $19,700 | $0 | $0 |
| 2020 | $1,123 | $17,700 | $0 | $0 |
| 2019 | $1,127 | $16,400 | $700 | $15,700 |
| 2018 | $944 | $17,098 | $0 | $0 |
| 2017 | $1,261 | $19,500 | $0 | $0 |
| 2016 | $1,288 | $19,912 | $0 | $0 |
| 2014 | -- | $20,584 | $0 | $19,832 |
| 2013 | -- | $21,484 | $0 | $0 |
Source: Public Records
Map
Nearby Homes
- 2206 N Bond St
- 2021 Benjamin St
- 2343 N Bond St
- 1833 N Bond St
- 815 W Genesee Ave
- 1616 State St
- 1826 Stone St
- 2104 Delaware Blvd
- 2004 Delaware St
- 1819 Stark St
- 1710 State St
- 1920 Hanchett St
- 2015 Delaware St
- 2207 Delaware Blvd
- 1818 N Woodbridge St
- 2459 Benjamin St
- 1720 N Oakley St
- 2463 Benjamin St
- 2450 N Mason St
- 2220 Mershon St
- 2115 N Bond St
- 1212 State St
- 1216 State St
- 2121 N Bond St
- 1220 State St
- 2114 N Bond St
- 1213 Davenport Ave
- 2118 N Bond St
- 2118 N Oakley St
- 2112 N Oakley St
- 2122 N Bond St
- 2120 N Oakley St
- 2203 N Bond St
- 1210 Davenport Ave
- 2202 N Bond St
- 2109 N Oakley St
- 1108 State St
- 2207 N Bond St
- 2202 N Oakley St
- 1302 State St