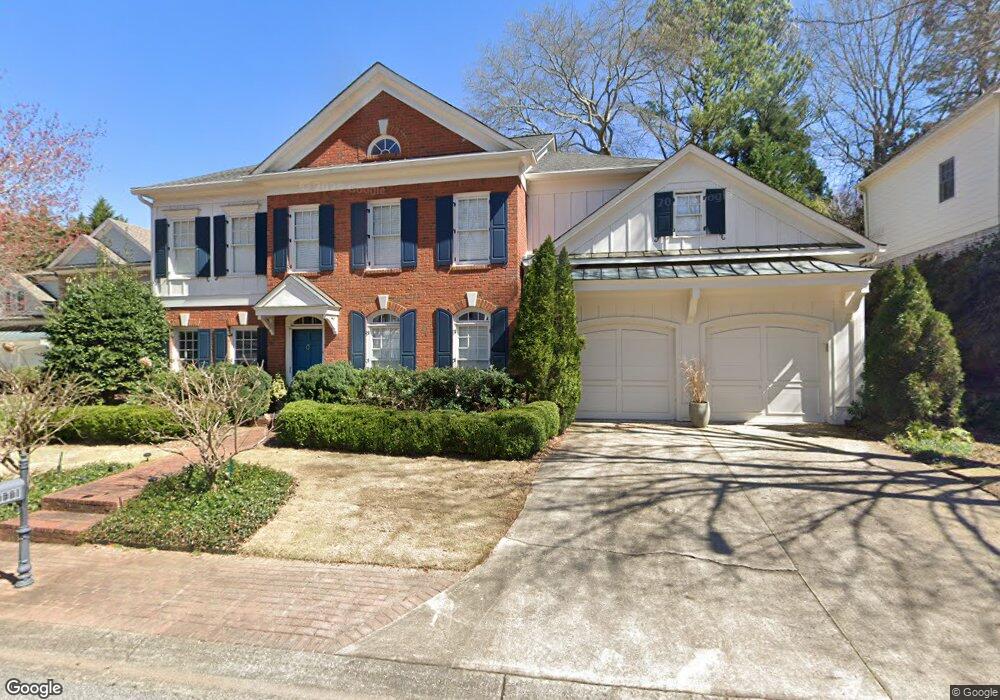
2111 Spring Hill Ct SE Smyrna, GA 30080
Estimated Value: $811,000 - $855,000
4
Beds
4
Baths
3,329
Sq Ft
$250/Sq Ft
Est. Value
About This Home
This home is located at 2111 Spring Hill Ct SE, Smyrna, GA 30080 and is currently estimated at $832,845, approximately $250 per square foot. 2111 Spring Hill Ct SE is a home located in Cobb County with nearby schools including Teasley Elementary School, Campbell Middle School, and Campbell High School.
Ownership History
Date
Name
Owned For
Owner Type
Purchase Details
Closed on
Jun 6, 2013
Sold by
Smith Randolph Q
Bought by
Sadler Mary
Current Estimated Value
Purchase Details
Closed on
Jan 3, 2008
Sold by
Lopriore Chris J and Lopriore Lee P
Bought by
Smith Randolph Q and Smith Barbara G
Home Financials for this Owner
Home Financials are based on the most recent Mortgage that was taken out on this home.
Original Mortgage
$350,000
Interest Rate
6.06%
Mortgage Type
New Conventional
Purchase Details
Closed on
Dec 16, 1998
Sold by
Piedmont Residential Llc
Bought by
Lopriore Chris J and Lopriore Lee P
Home Financials for this Owner
Home Financials are based on the most recent Mortgage that was taken out on this home.
Original Mortgage
$302,400
Interest Rate
6.72%
Mortgage Type
New Conventional
Create a Home Valuation Report for This Property
The Home Valuation Report is an in-depth analysis detailing your home's value as well as a comparison with similar homes in the area
Home Values in the Area
Average Home Value in this Area
Purchase History
| Date | Buyer | Sale Price | Title Company |
|---|---|---|---|
| Sadler Mary | $470,000 | -- | |
| Smith Randolph Q | $505,000 | -- | |
| Lopriore Chris J | $378,000 | -- |
Source: Public Records
Mortgage History
| Date | Status | Borrower | Loan Amount |
|---|---|---|---|
| Previous Owner | Smith Randolph Q | $350,000 | |
| Previous Owner | Lopriore Chris J | $302,400 |
Source: Public Records
Tax History Compared to Growth
Tax History
| Year | Tax Paid | Tax Assessment Tax Assessment Total Assessment is a certain percentage of the fair market value that is determined by local assessors to be the total taxable value of land and additions on the property. | Land | Improvement |
|---|---|---|---|---|
| 2025 | $2,419 | $293,468 | $64,000 | $229,468 |
| 2024 | $2,376 | $277,220 | $56,000 | $221,220 |
| 2023 | $2,170 | $277,220 | $56,000 | $221,220 |
| 2022 | $2,230 | $228,148 | $56,000 | $172,148 |
| 2021 | $5,855 | $192,924 | $56,000 | $136,924 |
| 2020 | $6,319 | $208,204 | $62,000 | $146,204 |
| 2019 | $6,319 | $208,204 | $62,000 | $146,204 |
| 2018 | $5,225 | $172,164 | $62,000 | $110,164 |
| 2017 | $4,950 | $172,164 | $62,000 | $110,164 |
| 2016 | $4,950 | $172,164 | $62,000 | $110,164 |
| 2015 | $4,320 | $146,624 | $66,000 | $80,624 |
| 2014 | $4,356 | $146,624 | $0 | $0 |
Source: Public Records
Map
Nearby Homes
- 3721 Paces Park Cir SE
- 2380 Montford Place SE
- 2282 McLean Chase SE
- 2351 Honeysuckle Ln SE
- 2128 Sonoma Dr SE
- 3475 Valley Vista Rd SE
- 1982 Cheyanne Dr SE
- 3465 Fenton Dr SE
- 2150 Whitestone Ct SE
- 3421 Valley Vista Rd SE
- 3854 Ridgewood Dr SE
- 3581 Ashcroft Dr SE
- 3927 Pineview Dr SE
- 3703 Tynemoore Trace SE
- 3916 Ridgewood Dr SE
- 3409 Bryerstone Cir SE
- 2115 Spring Hill Ct SE
- 2107 Spring Hill Ct SE
- 2114 Spring Hill Ct SE
- 0 Spring Hill Ct SE Unit 7279759
- 0 Spring Hill Ct SE Unit 7429340
- 0 Spring Hill Ct SE Unit 8445095
- 0 Spring Hill Ct SE Unit 8274518
- 0 Spring Hill Ct SE Unit 7457665
- 2118 Spring Hill Ct SE
- 2121 Spring Hill Ct SE
- 3648 Spring Hill Rd SE
- 2110 Spring Hill Ct SE
- 2103 Spring Hill Ct SE
- 3662 Spring Hill Rd SE
- 2102 Spring Hill Ct SE
- 2122 Spring Hill Ct SE
- 3668 Spring Hill Rd SE
- 2106 Spring Hill Ct SE
- 3620 Spring Hill Rd SE
- 2135 Spring Hill Ct SE