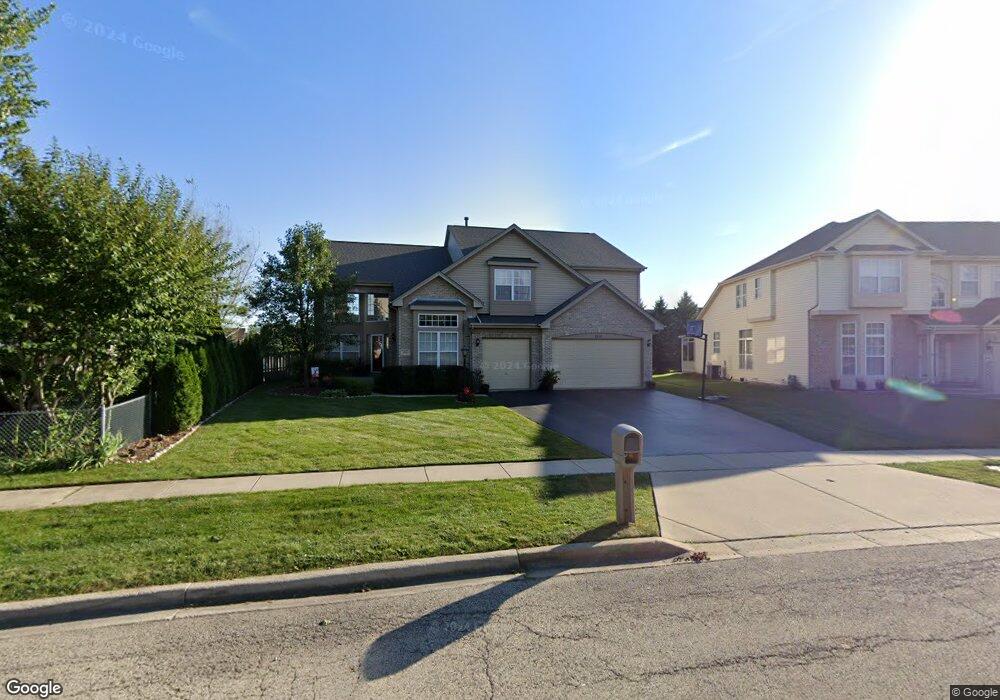
2111 Tracy Ln Unit 4 Algonquin, IL 60102
Estimated Value: $517,809 - $604,000
3
Beds
3
Baths
3,000
Sq Ft
$187/Sq Ft
Est. Value
About This Home
This home is located at 2111 Tracy Ln Unit 4, Algonquin, IL 60102 and is currently estimated at $562,202, approximately $187 per square foot. 2111 Tracy Ln Unit 4 is a home located in Kane County with nearby schools including Westfield Community School and Harry D Jacobs High School.
Ownership History
Date
Name
Owned For
Owner Type
Purchase Details
Closed on
Oct 29, 2010
Sold by
Wahlberg Bryan D and Wahlberg Debra C
Bought by
Bluhm Bryan M and Obrien Bluhm Melissa K
Current Estimated Value
Home Financials for this Owner
Home Financials are based on the most recent Mortgage that was taken out on this home.
Original Mortgage
$299,388
Outstanding Balance
$198,235
Interest Rate
4.34%
Mortgage Type
FHA
Estimated Equity
$363,967
Purchase Details
Closed on
Oct 28, 2002
Sold by
Bonds Ronald B and Bonds Tonja D
Bought by
Wahlberg Bryan P and Wahlberg Debra C
Home Financials for this Owner
Home Financials are based on the most recent Mortgage that was taken out on this home.
Original Mortgage
$292,600
Interest Rate
6.25%
Purchase Details
Closed on
May 3, 2000
Sold by
Willoughby Farms Third New Dimension Ltd
Bought by
Bonds Ronald and Bonds Tonia
Home Financials for this Owner
Home Financials are based on the most recent Mortgage that was taken out on this home.
Original Mortgage
$227,456
Interest Rate
7.87%
Create a Home Valuation Report for This Property
The Home Valuation Report is an in-depth analysis detailing your home's value as well as a comparison with similar homes in the area
Purchase History
| Date | Buyer | Sale Price | Title Company |
|---|---|---|---|
| Bluhm Bryan M | $303,500 | Heritage Title Company | |
| Wahlberg Bryan P | $308,000 | Ticor Title Insurance Co | |
| Bonds Ronald | $283,000 | Stewart Title Company |
Source: Public Records
Mortgage History
| Date | Status | Borrower | Loan Amount |
|---|---|---|---|
| Open | Bluhm Bryan M | $299,388 | |
| Previous Owner | Wahlberg Bryan P | $292,600 | |
| Previous Owner | Bonds Ronald | $227,456 | |
| Closed | Bonds Ronald | $42,648 |
Source: Public Records
Tax History
| Year | Tax Paid | Tax Assessment Tax Assessment Total Assessment is a certain percentage of the fair market value that is determined by local assessors to be the total taxable value of land and additions on the property. | Land | Improvement |
|---|---|---|---|---|
| 2024 | $11,488 | $159,691 | $26,492 | $133,199 |
| 2023 | $10,918 | $143,685 | $23,837 | $119,848 |
| 2022 | $11,000 | $139,534 | $23,837 | $115,697 |
| 2021 | $10,672 | $131,748 | $22,507 | $109,241 |
| 2020 | $10,460 | $128,786 | $22,001 | $106,785 |
| 2019 | $10,142 | $122,258 | $20,886 | $101,372 |
| 2018 | $10,213 | $119,837 | $20,472 | $99,365 |
| 2017 | $9,728 | $112,102 | $19,151 | $92,951 |
| 2016 | $9,489 | $103,622 | $18,543 | $85,079 |
| 2015 | -- | $94,523 | $17,040 | $77,483 |
| 2014 | -- | $90,376 | $16,569 | $73,807 |
| 2013 | -- | $92,500 | $17,076 | $75,424 |
Source: Public Records
Map
Nearby Homes
- 1227 Glenmont St
- 1020 Waterford St
- 2232 Stonegate Rd
- 2238 Stonegate Rd
- 1235 Glenmont St
- 111 Newburgh Ln
- 2252 Stonegate Rd
- 370 Coldsprings St
- 2020 Cosman Way
- 401 Coldsprings St
- 2250 Stonegate Rd
- 1020 Glenmont St
- 1090 Glenmont St
- 1111 Glenmont St
- 1080 Glenmont St
- 120 Newburgh Ln
- 2254 Stonegate Rd
- 1254 Glenmont St
- 2313 Barrett Dr
- 2248 Stonegate Rd
Your Personal Tour Guide
Ask me questions while you tour the home.