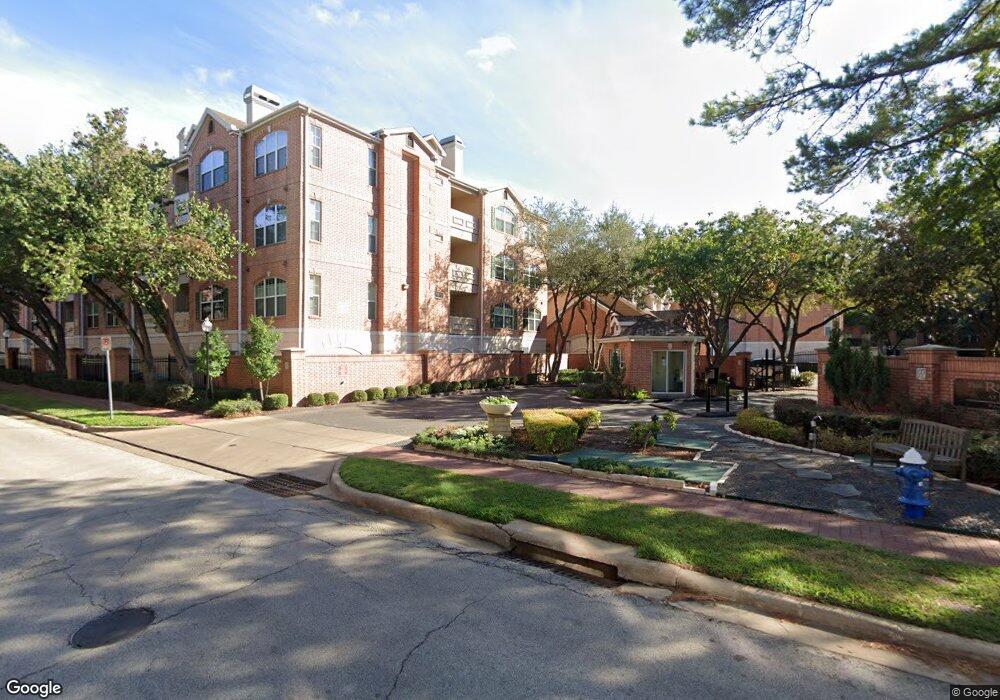
The Renaissance at River Oaks 2111 Welch St Unit B209 Houston, TX 77019
River Oaks NeighborhoodEstimated Value: $251,577 - $288,000
2
Beds
2
Baths
1,244
Sq Ft
$211/Sq Ft
Est. Value
About This Home
This home is located at 2111 Welch St Unit B209, Houston, TX 77019 and is currently estimated at $261,894, approximately $210 per square foot. 2111 Welch St Unit B209 is a home located in Harris County with nearby schools including River Oaks Elementary School, Lanier Middle School, and Lamar High School.
Ownership History
Date
Name
Owned For
Owner Type
Purchase Details
Closed on
Nov 18, 2019
Sold by
Elder Anne E and Kincaid Kevin
Bought by
Elder James H
Current Estimated Value
Purchase Details
Closed on
Mar 28, 2013
Sold by
Campbell Jonathan R
Bought by
Elder Anne E
Purchase Details
Closed on
Dec 17, 2012
Sold by
Zarella Kenneth and Us Bank Na
Bought by
Hreal Co Llc
Purchase Details
Closed on
Dec 5, 2012
Sold by
Hreal Company Llc
Bought by
Campbell Jonathan R
Purchase Details
Closed on
Feb 9, 2012
Sold by
Zarella Kenneth
Bought by
The Renaissance At River Oaks Unit Owner
Purchase Details
Closed on
Oct 31, 2003
Sold by
River Oaks Renaissance Llc
Bought by
Zarella Kenneth
Home Financials for this Owner
Home Financials are based on the most recent Mortgage that was taken out on this home.
Original Mortgage
$190,720
Interest Rate
5.62%
Mortgage Type
Purchase Money Mortgage
Create a Home Valuation Report for This Property
The Home Valuation Report is an in-depth analysis detailing your home's value as well as a comparison with similar homes in the area
Home Values in the Area
Average Home Value in this Area
Purchase History
| Date | Buyer | Sale Price | Title Company |
|---|---|---|---|
| Elder James H | -- | None Available | |
| Elder Anne E | -- | Startex Title | |
| Hreal Co Llc | -- | None Available | |
| Campbell Jonathan R | -- | Startex Title | |
| The Renaissance At River Oaks Unit Owner | -- | None Available | |
| Zarella Kenneth | -- | Chicago Title |
Source: Public Records
Mortgage History
| Date | Status | Borrower | Loan Amount |
|---|---|---|---|
| Previous Owner | Zarella Kenneth | $190,720 | |
| Closed | Zarella Kenneth | $47,680 |
Source: Public Records
Tax History Compared to Growth
Tax History
| Year | Tax Paid | Tax Assessment Tax Assessment Total Assessment is a certain percentage of the fair market value that is determined by local assessors to be the total taxable value of land and additions on the property. | Land | Improvement |
|---|---|---|---|---|
| 2025 | $5,126 | $265,160 | $50,380 | $214,780 |
| 2024 | $5,126 | $245,000 | $50,090 | $194,910 |
| 2023 | $5,126 | $259,781 | $51,907 | $207,874 |
| 2022 | $5,201 | $236,205 | $47,925 | $188,280 |
| 2021 | $5,477 | $235,000 | $47,210 | $187,790 |
| 2020 | $6,419 | $265,084 | $50,366 | $214,718 |
| 2019 | $6,387 | $252,402 | $47,956 | $204,446 |
| 2018 | $4,737 | $247,694 | $47,062 | $200,632 |
| 2017 | $6,263 | $247,694 | $47,062 | $200,632 |
| 2016 | $6,223 | $254,480 | $48,351 | $206,129 |
| 2015 | $4,025 | $254,480 | $48,351 | $206,129 |
| 2014 | $4,025 | $203,396 | $38,645 | $164,751 |
Source: Public Records
About The Renaissance at River Oaks
Map
Nearby Homes
- 2111 Welch St Unit A107
- 2111 Welch St Unit B220
- 2111 Welch St Unit B201
- 2111 Welch St Unit B109
- 2111 Welch St Unit A321
- 2100 Welch St Unit C113
- 2100 Welch St Unit C212
- 2100 Welch St Unit C101
- 1910 Huldy St Unit A
- 2027 Huldy St
- 2026 Welch St
- 2115 Huldy St
- 2113 Huldy St
- 2119 Huldy St
- 2207 Stanmore Dr
- 2211 Avalon Place
- 2224 Avalon Place
- 2221 Welch St Unit 401
- 2221 Welch St Unit 201
- 1909 Brun St Unit 17
- 2111 Welch St Unit A226
- 2111 Welch St Unit B211
- 2111 Welch St Unit A115
- 2111 Welch St Unit B313
- 2111 Welch St Unit A304
- 2111 Welch St Unit B219
- 2111 Welch St Unit B105
- 2111 Welch St
- 2111 Welch St Unit C214
- 2111 Welch St Unit C313
- 2111 Welch St Unit C305
- 2111 Welch St Unit C221
- 2111 Welch St Unit C218
- 2111 Welch St Unit C215
- 2111 Welch St Unit C211
- 2111 Welch St Unit C210
- 2111 Welch St Unit C209
- 2111 Welch St Unit C114
- 2111 Welch St
- 2111 Welch St