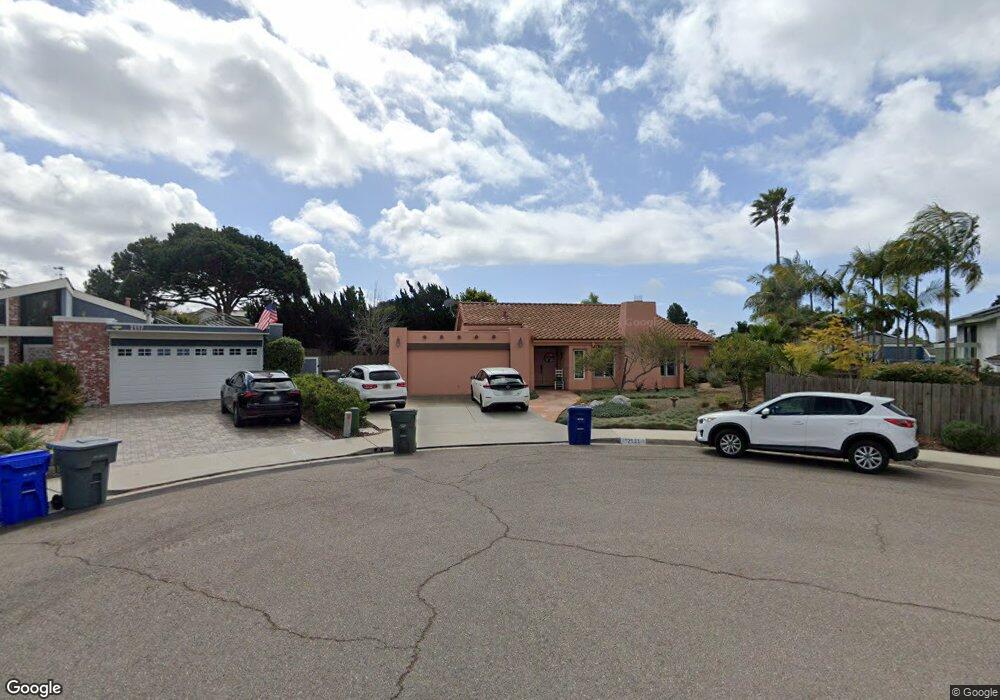
2111 Willowspring Place Encinitas, CA 92024
Central Encinitas NeighborhoodEstimated Value: $1,957,000 - $2,057,047
5
Beds
3
Baths
2,593
Sq Ft
$778/Sq Ft
Est. Value
About This Home
This home is located at 2111 Willowspring Place, Encinitas, CA 92024 and is currently estimated at $2,017,512, approximately $778 per square foot. 2111 Willowspring Place is a home located in San Diego County with nearby schools including Park Dale Lane Elementary, Diegueno Middle School, and La Costa Canyon High School.
Ownership History
Date
Name
Owned For
Owner Type
Purchase Details
Closed on
Sep 3, 2014
Sold by
King Michael R and King Ann
Bought by
King Family Trust and King Ann
Current Estimated Value
Purchase Details
Closed on
Apr 17, 2000
Sold by
King Family Trust 10-25-96 and Michael R
Bought by
King Michael R and King Annabelle
Home Financials for this Owner
Home Financials are based on the most recent Mortgage that was taken out on this home.
Original Mortgage
$145,000
Interest Rate
7.85%
Mortgage Type
Credit Line Revolving
Purchase Details
Closed on
Nov 7, 1996
Sold by
King Michael R and King Annabelle L
Bought by
King Michael R and King Annabelle
Create a Home Valuation Report for This Property
The Home Valuation Report is an in-depth analysis detailing your home's value as well as a comparison with similar homes in the area
Home Values in the Area
Average Home Value in this Area
Purchase History
| Date | Buyer | Sale Price | Title Company |
|---|---|---|---|
| King Family Trust | -- | None Available | |
| King Michael R | -- | None Available | |
| King Michael R | -- | Old Republic Title Company | |
| King Michael R | -- | -- |
Source: Public Records
Mortgage History
| Date | Status | Borrower | Loan Amount |
|---|---|---|---|
| Closed | King Michael R | $145,000 |
Source: Public Records
Tax History
| Year | Tax Paid | Tax Assessment Tax Assessment Total Assessment is a certain percentage of the fair market value that is determined by local assessors to be the total taxable value of land and additions on the property. | Land | Improvement |
|---|---|---|---|---|
| 2025 | $3,497 | $280,093 | $95,099 | $184,994 |
| 2024 | $3,497 | $274,602 | $93,235 | $181,367 |
| 2023 | $3,368 | $269,218 | $91,407 | $177,811 |
| 2022 | $3,268 | $263,940 | $89,615 | $174,325 |
| 2021 | $3,193 | $258,765 | $87,858 | $170,907 |
| 2020 | $3,124 | $256,113 | $86,958 | $169,155 |
| 2019 | $3,066 | $251,092 | $85,253 | $165,839 |
| 2018 | $3,025 | $246,170 | $83,582 | $162,588 |
| 2017 | $2,976 | $241,344 | $81,944 | $159,400 |
| 2016 | $2,892 | $236,613 | $80,338 | $156,275 |
| 2015 | $2,825 | $233,060 | $79,132 | $153,928 |
| 2014 | $2,746 | $228,495 | $77,582 | $150,913 |
Source: Public Records
Map
Nearby Homes
- 516 Whisper Wind Dr
- 277 Via Del Cerrito
- 1824 Eastwood Ln
- 1741 Charleston Ln
- 324 Countrywood Ln
- 1830 Gatepost Rd
- 1926 Springdale Ln
- 2037 Countrywood Way
- 121 Avenida Esperanza
- 612 Lucylle Ln
- 1822 Stanton Rd Unit 302
- 1971 Azure Way
- 905 Olive Crest Dr
- 2118 Valleydale Ln
- 1644 Forestdale Dr
- 245 Fairlee Ln
- 1982 Fairlee Dr
- 528 Flores de Oro
- 1709 Edgefield Ln
- 804 & 814 Clark Ave
- 2117 Willowspring Place
- 2118 Park Dale Ln
- 279 Willowspring Dr N
- 285 Willowspring Dr N Unit 11
- 273 Willowspring Dr N
- 2116 Willowspring Place
- 250 Sierra Ridge Dr
- 266 Sierra Ridge Dr
- 2124 Park Dale Ln
- 234 Sierra Ridge Dr
- 2110 Willowspring Place
- 282 Sierra Ridge Dr
- 218 Sierra Ridge Dr
- 2106 Park Dale Ln
- 2104 Willowspring Place
- 312 Sierra Ridge Dr
- 202 Sierra Ridge Dr
- 2121 Park Dale Ln
- 320 Sierra Ridge Dr
- 309 Willowspring Dr N
Your Personal Tour Guide
Ask me questions while you tour the home.