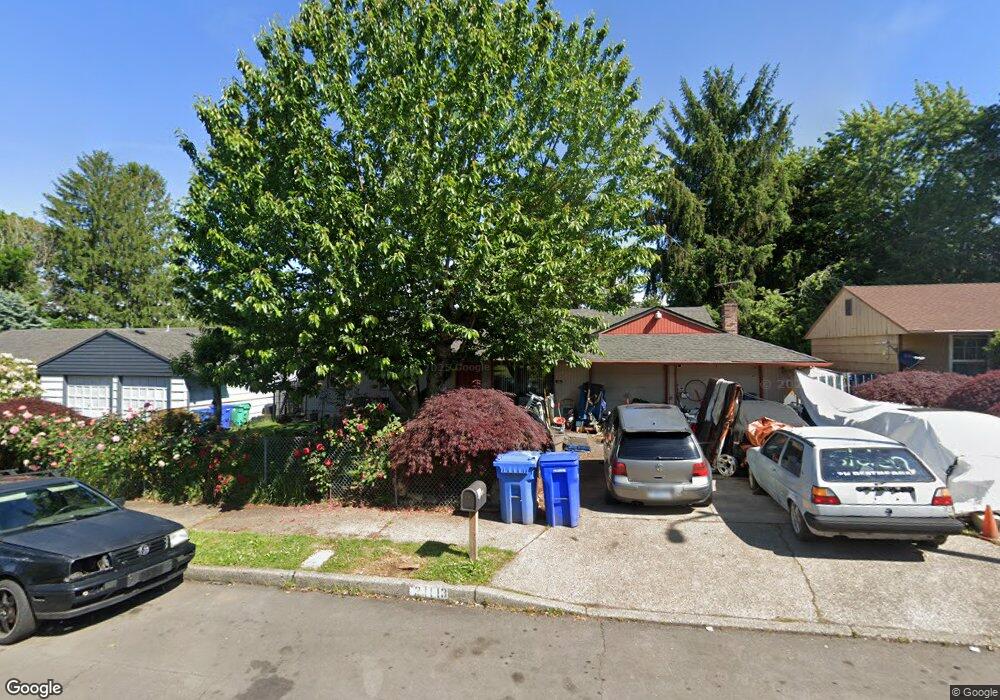
21113 SE Salmon St Gresham, OR 97030
North Central NeighborhoodEstimated Value: $413,887 - $436,000
3
Beds
2
Baths
1,344
Sq Ft
$317/Sq Ft
Est. Value
About This Home
This home is located at 21113 SE Salmon St, Gresham, OR 97030 and is currently estimated at $425,472, approximately $316 per square foot. 21113 SE Salmon St is a home located in Multnomah County with nearby schools including North Gresham Elementary School, Clear Creek Middle School, and Gresham High School.
Ownership History
Date
Name
Owned For
Owner Type
Purchase Details
Closed on
Sep 24, 2021
Sold by
Deangelo Dorothy E
Bought by
Bayer Allen James
Current Estimated Value
Home Financials for this Owner
Home Financials are based on the most recent Mortgage that was taken out on this home.
Original Mortgage
$312,000
Outstanding Balance
$283,277
Interest Rate
2.8%
Mortgage Type
New Conventional
Estimated Equity
$142,195
Create a Home Valuation Report for This Property
The Home Valuation Report is an in-depth analysis detailing your home's value as well as a comparison with similar homes in the area
Home Values in the Area
Average Home Value in this Area
Purchase History
| Date | Buyer | Sale Price | Title Company |
|---|---|---|---|
| Bayer Allen James | $390,000 | Fidelity National Title |
Source: Public Records
Mortgage History
| Date | Status | Borrower | Loan Amount |
|---|---|---|---|
| Open | Bayer Allen James | $312,000 |
Source: Public Records
Tax History
| Year | Tax Paid | Tax Assessment Tax Assessment Total Assessment is a certain percentage of the fair market value that is determined by local assessors to be the total taxable value of land and additions on the property. | Land | Improvement |
|---|---|---|---|---|
| 2025 | $4,088 | $200,890 | -- | -- |
| 2024 | $3,913 | $195,040 | -- | -- |
| 2023 | $3,565 | $189,360 | $0 | $0 |
| 2022 | $3,466 | $183,850 | $0 | $0 |
| 2021 | $3,378 | $178,500 | $0 | $0 |
| 2020 | $3,179 | $173,310 | $0 | $0 |
| 2019 | $3,096 | $168,270 | $0 | $0 |
| 2018 | $2,952 | $163,370 | $0 | $0 |
| 2017 | $2,832 | $158,620 | $0 | $0 |
| 2016 | $2,497 | $154,000 | $0 | $0 |
Source: Public Records
Map
Nearby Homes
- 1208 SE 209th Ave
- 21001 SE Yamhill St
- 1026 SE 209th Ave
- 920 SE 214th Ave
- 21016 SE Stark St Unit 71
- 21016 SE Stark St Unit 69
- 2013 NW Bella Vista Dr
- 21260 SE Stark St
- 21400 SE Stark St Unit 2
- 1711 NW 19th St
- 1861 NW Wonderview Ave
- 1758 NW 18th Ct
- 209 SE 214th Ave
- 21525 SE Oak St
- 132 SE 214th Ave
- 1035 SE 225th Ave
- 0 SE Burnside St
- 19776 SE Stark St Unit 147
- 1387 NW Riverview Ave Unit 14B
- 805 SE 197th Ave
- 21127 SE Salmon St
- 21101 SE Salmon St
- 21122 SE Taylor Ct
- 21118 SE Taylor Ct
- 21110 SE Salmon St
- 21141 SE Salmon St
- 21041 SE Salmon St
- 1025 SE 212th Ave
- 21110 SE Taylor Ct
- 21130 SE Salmon St
- 21040 SE Salmon St
- 1212 SE 211th Ave
- 1015 SE 212th Ave
- 21033 SE Salmon St
- 21125 SE Taylor Ct
- 1211 SE 212th Ave
- 21100 SE Taylor Ct
- 1213 SE 211th Ave
- 1009 SE 212th Ave
- 21025 SE Salmon St
Your Personal Tour Guide
Ask me questions while you tour the home.