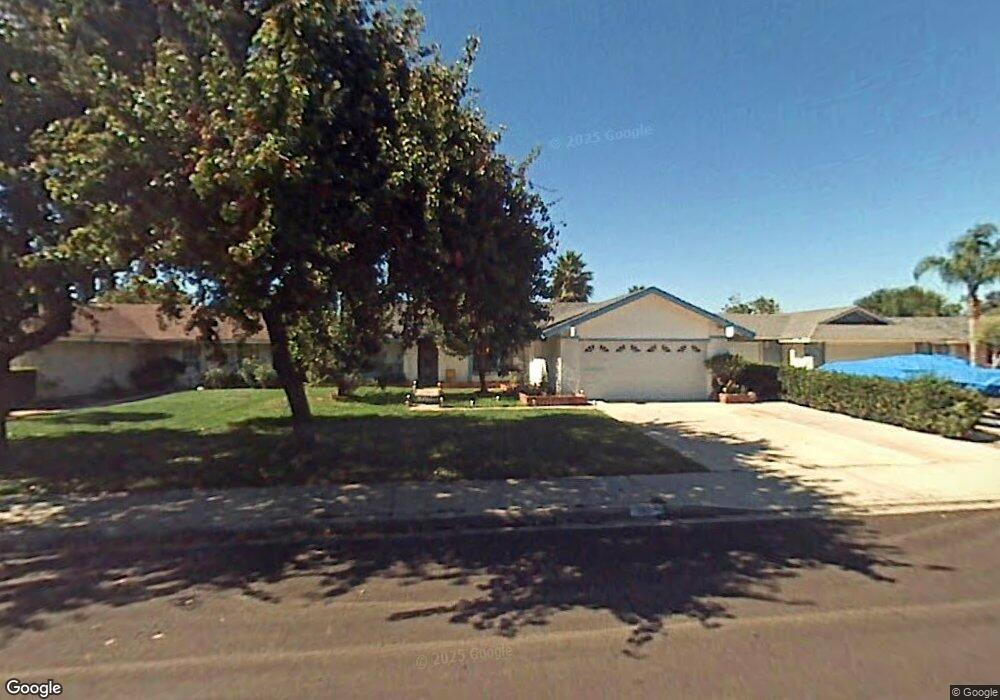
2112 Caldwell Place Ontario, CA 91761
Downtown Ontario NeighborhoodEstimated Value: $690,000 - $738,000
4
Beds
2
Baths
1,426
Sq Ft
$495/Sq Ft
Est. Value
About This Home
This home is located at 2112 Caldwell Place, Ontario, CA 91761 and is currently estimated at $705,819, approximately $494 per square foot. 2112 Caldwell Place is a home located in San Bernardino County with nearby schools including Bon View Elementary, De Anza Middle, and Ontario High School.
Ownership History
Date
Name
Owned For
Owner Type
Purchase Details
Closed on
Aug 8, 2013
Sold by
Nguyen Frank
Bought by
Nguyen Tommy and Nguyen Margie Hong
Current Estimated Value
Purchase Details
Closed on
Apr 30, 1998
Sold by
Nguyen Phuoc H and Lai Van Hong
Bought by
Nguyen Frank and Lai Van Hong
Home Financials for this Owner
Home Financials are based on the most recent Mortgage that was taken out on this home.
Original Mortgage
$60,000
Interest Rate
7.05%
Create a Home Valuation Report for This Property
The Home Valuation Report is an in-depth analysis detailing your home's value as well as a comparison with similar homes in the area
Home Values in the Area
Average Home Value in this Area
Purchase History
| Date | Buyer | Sale Price | Title Company |
|---|---|---|---|
| Nguyen Tommy | -- | None Available | |
| Nguyen Frank | -- | Fidelity National Title Ins |
Source: Public Records
Mortgage History
| Date | Status | Borrower | Loan Amount |
|---|---|---|---|
| Closed | Nguyen Frank | $60,000 |
Source: Public Records
Tax History Compared to Growth
Tax History
| Year | Tax Paid | Tax Assessment Tax Assessment Total Assessment is a certain percentage of the fair market value that is determined by local assessors to be the total taxable value of land and additions on the property. | Land | Improvement |
|---|---|---|---|---|
| 2025 | $3,343 | $306,465 | $106,650 | $199,815 |
| 2024 | $3,343 | $300,456 | $104,559 | $195,897 |
| 2023 | $3,250 | $294,565 | $102,509 | $192,056 |
| 2022 | $3,208 | $288,789 | $100,499 | $188,290 |
| 2021 | $3,188 | $283,126 | $98,528 | $184,598 |
| 2020 | $3,133 | $280,223 | $97,518 | $182,705 |
| 2019 | $3,107 | $274,729 | $95,606 | $179,123 |
| 2018 | $3,064 | $269,342 | $93,731 | $175,611 |
| 2017 | $2,956 | $264,061 | $91,893 | $172,168 |
| 2016 | $2,841 | $258,883 | $90,091 | $168,792 |
| 2015 | $2,822 | $254,995 | $88,738 | $166,257 |
| 2014 | $2,736 | $250,000 | $87,000 | $163,000 |
Source: Public Records
Map
Nearby Homes
- 2119 S Phoenix Place
- 2030 S Bon View Ave Unit G
- 2001 S Campus Ave Unit 7F
- 840 E Cedar St
- 2148 S Sultana Ave
- 2408 S Taylor Place
- 4235 S Gasly Paseo
- 0 Vineyard Unit CV25067044
- 4245 S Grasly Paseo
- 4233 S Grasly Paseo
- 0 Phillips Unit CV23180894
- 2300 S Sultana Ave Unit 298
- 310 E Philadelphia St Unit 35
- 310 E Philadelphia St
- 513 E Fairfield Ct
- 304 E Cedar St
- 2437 S Garfield Place
- 1650 S Campus Ave Unit 21
- 1650 S Campus Ave Unit 20
- 2453 S Marigold Place
- 2120 Caldwell Place
- 2108 Caldwell Place
- 2128 Caldwell Place
- 2109 S Phoenix Place
- 2111000 Phoenix Place
- 2119 S Phoenix Place
- 2104 Caldwell Place
- 2105 S Phoenix Place
- 2127 S Phoenix Place
- 2111 Caldwell Place
- 2119 Caldwell Place
- 2109 Caldwell Place
- 2102 Caldwell Place
- 2127 Caldwell Place
- 2101 Caldwell Place
- 2103 S Phoenix Place
- 2105 Caldwell Place
- 2103 Caldwell Place
- 741 E Philadelphia St
- 2112 S Taylor Place