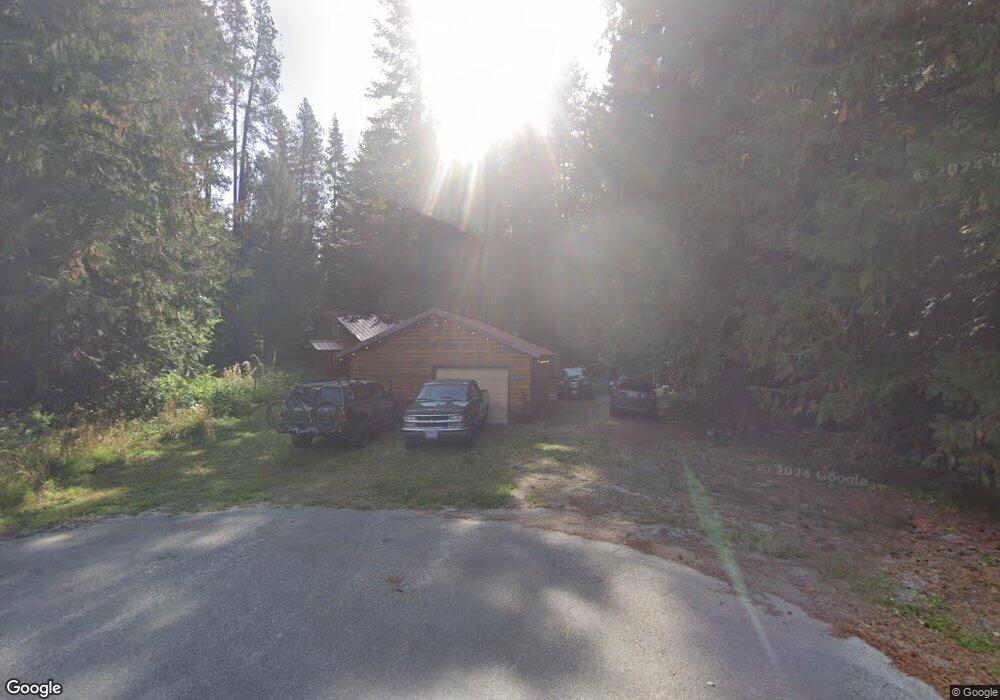
2112 Chiwawa Ct Leavenworth, WA 98826
Estimated Value: $772,774 - $865,000
2
Beds
1
Bath
1,008
Sq Ft
$800/Sq Ft
Est. Value
About This Home
This home is located at 2112 Chiwawa Ct, Leavenworth, WA 98826 and is currently estimated at $806,591, approximately $800 per square foot. 2112 Chiwawa Ct is a home located in Chelan County with nearby schools including Cascade High School.
Ownership History
Date
Name
Owned For
Owner Type
Purchase Details
Closed on
Mar 23, 2012
Sold by
Vanleeuwen Ann M
Bought by
Vanleeuwen Huib
Current Estimated Value
Home Financials for this Owner
Home Financials are based on the most recent Mortgage that was taken out on this home.
Original Mortgage
$200,000
Outstanding Balance
$137,189
Interest Rate
3.84%
Mortgage Type
New Conventional
Estimated Equity
$669,402
Purchase Details
Closed on
Dec 1, 2005
Sold by
Byrd Keith Martin and Byrd Deborah Ann
Bought by
Colasurdo Linda J
Home Financials for this Owner
Home Financials are based on the most recent Mortgage that was taken out on this home.
Original Mortgage
$128,000
Interest Rate
6.07%
Mortgage Type
Purchase Money Mortgage
Purchase Details
Closed on
Mar 24, 2005
Sold by
Mccaffery Rick D and Mccaffery Cynthia I
Bought by
Vanvanleeuwen Huib Van and Van Leeuwen Ann M
Home Financials for this Owner
Home Financials are based on the most recent Mortgage that was taken out on this home.
Original Mortgage
$215,950
Interest Rate
5.25%
Mortgage Type
Adjustable Rate Mortgage/ARM
Create a Home Valuation Report for This Property
The Home Valuation Report is an in-depth analysis detailing your home's value as well as a comparison with similar homes in the area
Home Values in the Area
Average Home Value in this Area
Purchase History
| Date | Buyer | Sale Price | Title Company |
|---|---|---|---|
| Vanleeuwen Huib | -- | North Meridian Title & Escro | |
| Colasurdo Linda J | $160,000 | Transnation Title Insurance | |
| Vanvanleeuwen Huib Van | $269,669 | First American Title |
Source: Public Records
Mortgage History
| Date | Status | Borrower | Loan Amount |
|---|---|---|---|
| Open | Vanleeuwen Huib | $200,000 | |
| Closed | Colasurdo Linda J | $128,000 | |
| Previous Owner | Vanvanleeuwen Huib Van | $215,950 |
Source: Public Records
Tax History Compared to Growth
Tax History
| Year | Tax Paid | Tax Assessment Tax Assessment Total Assessment is a certain percentage of the fair market value that is determined by local assessors to be the total taxable value of land and additions on the property. | Land | Improvement |
|---|---|---|---|---|
| 2021 | $4,210 | $450,690 | $101,430 | $349,260 |
| 2020 | $3,056 | $311,461 | $105,408 | $206,053 |
| 2019 | $2,829 | $306,401 | $107,730 | $198,671 |
| 2018 | $3,638 | $276,975 | $90,900 | $186,075 |
| 2017 | $2,898 | $329,021 | $97,722 | $231,299 |
| 2016 | $2,229 | $278,376 | $94,428 | $183,948 |
| 2015 | $2,229 | $248,255 | $100,620 | $147,635 |
| 2013 | $2,229 | $218,850 | $67,500 | $151,350 |
Source: Public Records
Map
Nearby Homes
- 2316 Pine Tree Rd
- 11190 Meadow Dr
- 2205 Pine Tree Rd
- 2233 Riffle Dr
- 10919 Wending Ln
- 2620 Wenatchee Pines
- 2514 Kinnikinnick Dr
- 2290 Riffle Dr
- 2628 Cottonwood Ln
- 20106 Shugart Flats Rd
- 11411 Shugart Flats Rd
- 19990 S Shugart Flats Rd
- 0 S Shugart Flats Rd
- 12360 W Shurgart Flats Rd
- 12469 W Shugart Flats Rd
- 19374 Westside Dr
- 0 Little Chumstick Creek Rd Unit NWM2436769
- 19160 Westside Dr
- 18725 River Rd
- 18495 Camp 12 Rd
- 2117 Chiwawa Ct
- 2110 Chiwawa Ct
- 2107 Chiwawa Ct
- 2106 Chiwawa Ct
- 2115 Chiwawa Ct
- 2306 Pine Tree Rd
- 2310 Pine Tree Rd
- 2309 Pine Tree Rd
- 2307 Pine Tree Rd
- 2304 Pine Tree Rd
- 2105 Chiwawa Ct
- 2311 Pine Tree Rd
- 2312 Pine Tree Rd
- 2102 Chiwawa Loop Rd
- 2303 Pine Tree Rd
- 2303 Pine Tree Rd
- 2103 Chiwawa Ct
- 2103 Chiwawa Ct
- 2103 Chiwawa Ct
- 2313 Pine Tree Rd