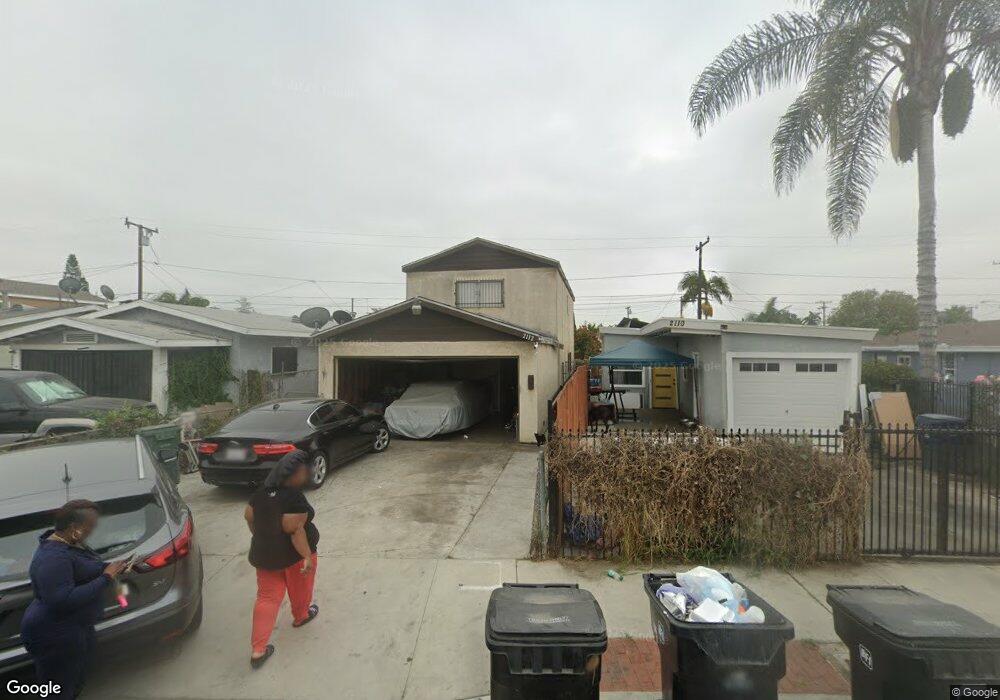
2112 E Knopf St Compton, CA 90222
Estimated Value: $580,000 - $665,000
3
Beds
2
Baths
1,546
Sq Ft
$400/Sq Ft
Est. Value
About This Home
This home is located at 2112 E Knopf St, Compton, CA 90222 and is currently estimated at $618,972, approximately $400 per square foot. 2112 E Knopf St is a home located in Los Angeles County with nearby schools including Anderson Elementary School, Bunche Middle School, and Centennial High School.
Ownership History
Date
Name
Owned For
Owner Type
Purchase Details
Closed on
Jan 12, 2002
Sold by
The Mary Jackson Trust
Bought by
Jackson Kipling and Williams Pamela
Current Estimated Value
Purchase Details
Closed on
Sep 11, 2000
Sold by
Jackson Mary A
Bought by
The Mary Jackson Trust
Purchase Details
Closed on
Aug 28, 1996
Sold by
Jackson Marcia T
Bought by
Jackson Kipling Mark and Williams Pamela
Home Financials for this Owner
Home Financials are based on the most recent Mortgage that was taken out on this home.
Original Mortgage
$67,026
Outstanding Balance
$5,308
Interest Rate
8.23%
Mortgage Type
FHA
Estimated Equity
$613,664
Purchase Details
Closed on
Aug 3, 1996
Sold by
Jackson Mary Arce
Bought by
Jackson Mary Arce and Jackson Kipling Mark
Home Financials for this Owner
Home Financials are based on the most recent Mortgage that was taken out on this home.
Original Mortgage
$67,026
Outstanding Balance
$5,308
Interest Rate
8.23%
Mortgage Type
FHA
Estimated Equity
$613,664
Create a Home Valuation Report for This Property
The Home Valuation Report is an in-depth analysis detailing your home's value as well as a comparison with similar homes in the area
Home Values in the Area
Average Home Value in this Area
Purchase History
| Date | Buyer | Sale Price | Title Company |
|---|---|---|---|
| Jackson Kipling | -- | -- | |
| Jackson Kipling Mark | -- | -- | |
| The Mary Jackson Trust | -- | -- | |
| Jackson Kipling Mark | -- | Fidelity National Title | |
| Jackson Mary Arce | -- | Fidelity National Title |
Source: Public Records
Mortgage History
| Date | Status | Borrower | Loan Amount |
|---|---|---|---|
| Open | Jackson Mary Arce | $67,026 |
Source: Public Records
Tax History
| Year | Tax Paid | Tax Assessment Tax Assessment Total Assessment is a certain percentage of the fair market value that is determined by local assessors to be the total taxable value of land and additions on the property. | Land | Improvement |
|---|---|---|---|---|
| 2025 | $3,002 | $194,972 | $92,365 | $102,607 |
| 2024 | $3,002 | $191,150 | $90,554 | $100,596 |
| 2023 | $2,966 | $187,403 | $88,779 | $98,624 |
| 2022 | $2,780 | $183,730 | $87,039 | $96,691 |
| 2021 | $2,818 | $180,129 | $85,333 | $94,796 |
| 2019 | $2,741 | $174,788 | $82,803 | $91,985 |
| 2018 | $2,660 | $171,362 | $81,180 | $90,182 |
| 2016 | $2,515 | $164,710 | $78,029 | $86,681 |
| 2015 | $2,394 | $162,236 | $76,857 | $85,379 |
| 2014 | $2,356 | $159,059 | $75,352 | $83,707 |
Source: Public Records
Map
Nearby Homes
- 2063 E Knopf St
- 2102 E Lucien St
- 2107 E Stockwell St
- 2207 N Anzac Ave
- 2121 E Piru St
- 1808 N Grape Ave
- 2062 E Hatchway St
- 13115 S Largo Ave
- 1608 N Grape Ave
- 850 W 132nd St
- 2310 E Stockwell St
- 13300 S Largo Ave
- 720 W 137th St
- 2402 E 126th St
- 917 W 130th St
- 701 W 139th St
- 2511 E 131st St
- 2222 E 124th St
- 12624 S Mona Blvd
- 629 W Plum St
- 2110 E Knopf St
- 2118 E Knopf St
- 2108 E Knopf St
- 2122 E Knopf St
- 2115 E Nord St
- 2111 E Nord St
- 2117 E Nord St
- 2102 E Knopf St
- 2121 E Nord St
- 2124 E Knopf St
- 2111 E Knopf St
- 2125 E Nord St
- 2117 E Knopf St
- 2105 E Knopf St
- 2128 E Knopf St
- 2119 E Knopf St
- 2103 E Knopf St
- 2101 E Nord St
- 2121 E Knopf St
- 2101 E Knopf St
Your Personal Tour Guide
Ask me questions while you tour the home.