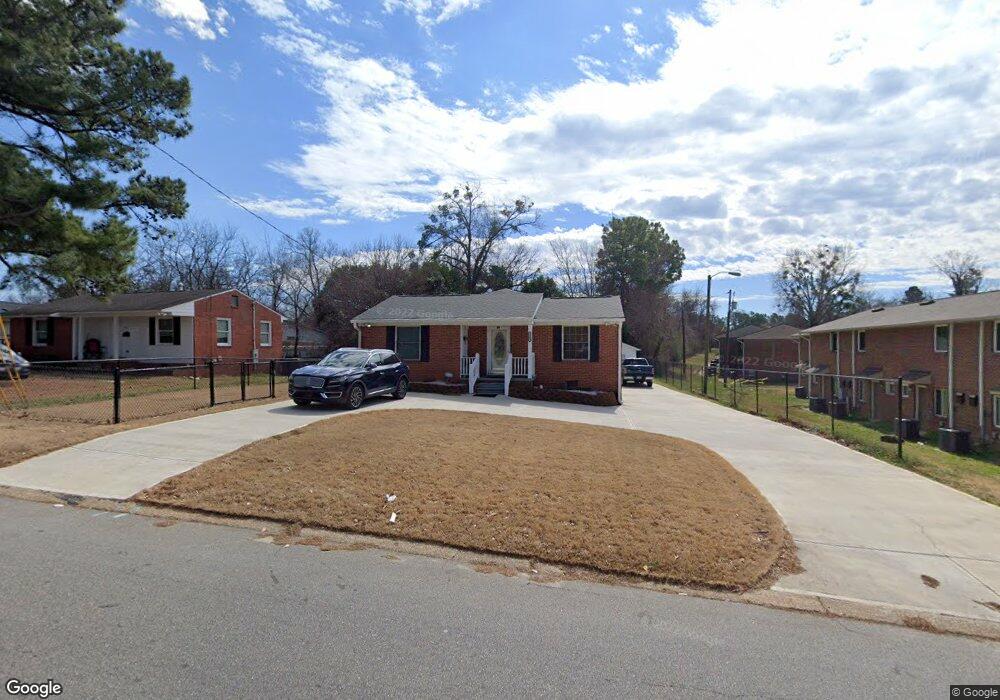
2112 Millbank St Raleigh, NC 27610
Belvedere Park NeighborhoodEstimated Value: $319,065 - $406,000
--
Bed
2
Baths
1,299
Sq Ft
$287/Sq Ft
Est. Value
About This Home
This home is located at 2112 Millbank St, Raleigh, NC 27610 and is currently estimated at $372,766, approximately $286 per square foot. 2112 Millbank St is a home located in Wake County with nearby schools including Powell Elementary, Leroy Martin Magnet, and Enloe High.
Ownership History
Date
Name
Owned For
Owner Type
Purchase Details
Closed on
Aug 18, 2021
Sold by
Taylor Robert J
Bought by
Fowler Robert Leroy and Fowler Pearlie J
Current Estimated Value
Home Financials for this Owner
Home Financials are based on the most recent Mortgage that was taken out on this home.
Original Mortgage
$276,426
Outstanding Balance
$251,357
Interest Rate
2.9%
Mortgage Type
VA
Estimated Equity
$121,409
Purchase Details
Closed on
Aug 13, 2021
Sold by
Taylor Lena T and Taylor Robert J
Bought by
Taylor Lena T
Home Financials for this Owner
Home Financials are based on the most recent Mortgage that was taken out on this home.
Original Mortgage
$276,426
Outstanding Balance
$251,357
Interest Rate
2.9%
Mortgage Type
VA
Estimated Equity
$121,409
Purchase Details
Closed on
Jan 24, 1986
Bought by
Taylor Robert J and Taylor Lena T
Create a Home Valuation Report for This Property
The Home Valuation Report is an in-depth analysis detailing your home's value as well as a comparison with similar homes in the area
Home Values in the Area
Average Home Value in this Area
Purchase History
| Date | Buyer | Sale Price | Title Company |
|---|---|---|---|
| Fowler Robert Leroy | -- | -- | |
| Taylor Lena T | -- | Accommodation | |
| Fowler Robert Leroy | -- | -- | |
| Taylor Robert J | $50,000 | -- |
Source: Public Records
Mortgage History
| Date | Status | Borrower | Loan Amount |
|---|---|---|---|
| Open | Fowler Robert Leroy | $276,426 | |
| Previous Owner | Fowler Robert Leroy | $108,640 | |
| Previous Owner | Fowler Robert Leroy | $38,450 | |
| Previous Owner | Fowler Robert Leroy | $19,500 |
Source: Public Records
Tax History Compared to Growth
Tax History
| Year | Tax Paid | Tax Assessment Tax Assessment Total Assessment is a certain percentage of the fair market value that is determined by local assessors to be the total taxable value of land and additions on the property. | Land | Improvement |
|---|---|---|---|---|
| 2025 | $2,794 | $318,112 | $175,000 | $143,112 |
| 2024 | $2,783 | $318,112 | $175,000 | $143,112 |
| 2023 | $2,217 | $201,561 | $95,000 | $106,561 |
| 2022 | $2,061 | $201,561 | $95,000 | $106,561 |
| 2021 | $1,543 | $201,561 | $95,000 | $106,561 |
| 2020 | $1,515 | $201,561 | $95,000 | $106,561 |
| 2019 | $893 | $120,340 | $40,000 | $80,340 |
| 2018 | $843 | $120,340 | $40,000 | $80,340 |
| 2017 | $804 | $120,340 | $40,000 | $80,340 |
| 2016 | $788 | $120,340 | $40,000 | $80,340 |
| 2015 | $726 | $113,147 | $32,000 | $81,147 |
| 2014 | $689 | $113,147 | $32,000 | $81,147 |
Source: Public Records
Map
Nearby Homes
- 1206 Downing Rd
- 1210 Downing Rd
- 2207 Millbank St
- 2201 Millbank Village Ct Unit 101
- 1300 Park Glen Dr Unit 101
- 1005 Phoenix Place
- 1001 Phoenix Place
- 1129 Marlborough Rd
- 1121 Marlborough Rd
- 1000 Glascock St Unit 101 & 102
- 2231 Rumson Rd
- 1421 Lions Way
- 2400 Remington Rd
- 2318 Glascock St
- 1012 Addison Place
- 500 Banks St
- 1016 Addison Place
- 1409 Lions Way
- 1105 Glascock St Unit 101
- 1105 Glascock St Unit 101 & 102
- 2116 Millbank St
- 1153 Brighton Rd
- 1149 Brighton Rd
- 2120 Millbank St
- 1145 Brighton Rd
- 1201 Downing Rd
- 1200 Downing Rd
- 1141 Brighton Rd
- 1205 Downing Rd
- 2119 Millbank St
- 1137 Brighton Rd
- 2200 Millbank St
- 1148 Brighton Rd
- 1144 Brighton Rd
- 1209 Downing Rd
- 1138 Brighton Rd
- 1205 Brighton Rd
- 1133 Brighton Rd
- 2201 Millbank St
- 2201 Millbank St Unit 101