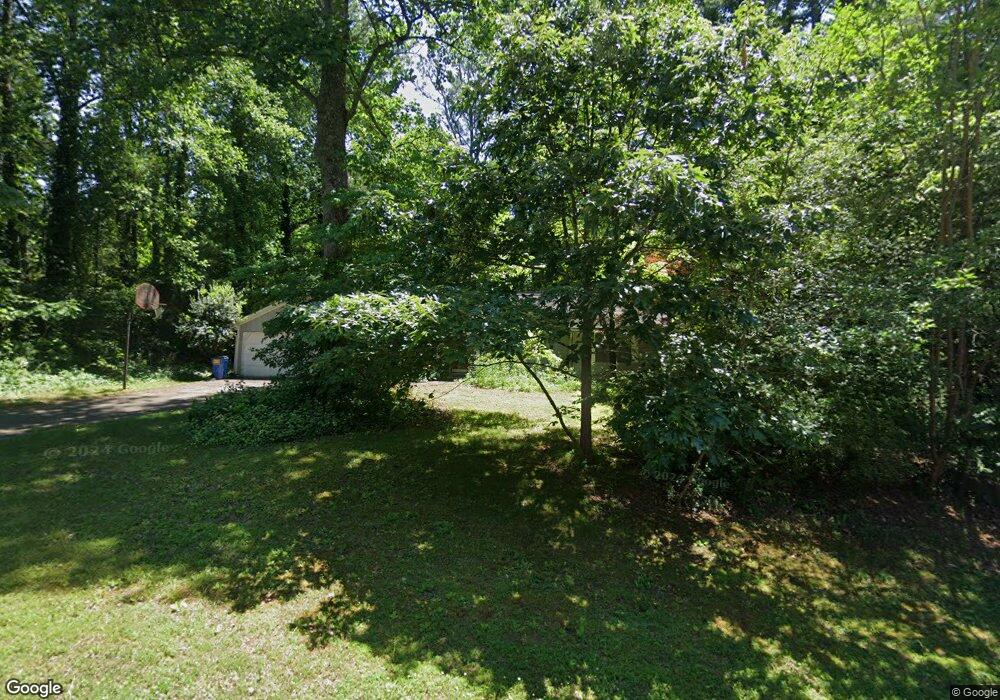
2112 N Sound Trail Marietta, GA 30066
Sandy Plains NeighborhoodEstimated Value: $370,000 - $441,000
3
Beds
2
Baths
1,753
Sq Ft
$229/Sq Ft
Est. Value
About This Home
This home is located at 2112 N Sound Trail, Marietta, GA 30066 and is currently estimated at $402,128, approximately $229 per square foot. 2112 N Sound Trail is a home located in Cobb County with nearby schools including Keheley Elementary School and McCleskey Middle School.
Ownership History
Date
Name
Owned For
Owner Type
Purchase Details
Closed on
Nov 13, 2008
Sold by
Bunch Alice S
Bought by
Gray Darryl and Gray Carol S
Current Estimated Value
Purchase Details
Closed on
Jan 22, 2008
Sold by
Hollett Sandra L
Bought by
Bunch Alice S
Home Financials for this Owner
Home Financials are based on the most recent Mortgage that was taken out on this home.
Original Mortgage
$138,400
Interest Rate
6.06%
Mortgage Type
New Conventional
Purchase Details
Closed on
May 29, 2003
Sold by
Pitts Donna H
Bought by
Hollett Sandra L
Home Financials for this Owner
Home Financials are based on the most recent Mortgage that was taken out on this home.
Original Mortgage
$120,000
Interest Rate
5.29%
Mortgage Type
New Conventional
Purchase Details
Closed on
May 30, 2000
Sold by
Leshynski Wayne A
Bought by
Pitts Donna H
Home Financials for this Owner
Home Financials are based on the most recent Mortgage that was taken out on this home.
Original Mortgage
$116,800
Interest Rate
8.14%
Mortgage Type
New Conventional
Create a Home Valuation Report for This Property
The Home Valuation Report is an in-depth analysis detailing your home's value as well as a comparison with similar homes in the area
Home Values in the Area
Average Home Value in this Area
Purchase History
| Date | Buyer | Sale Price | Title Company |
|---|---|---|---|
| Gray Darryl | -- | -- | |
| Gray Darryl | $160,000 | -- | |
| Bunch Alice S | $173,000 | -- | |
| Hollett Sandra L | $159,000 | -- | |
| Pitts Donna H | $137,500 | -- |
Source: Public Records
Mortgage History
| Date | Status | Borrower | Loan Amount |
|---|---|---|---|
| Previous Owner | Bunch Alice S | $138,400 | |
| Previous Owner | Hollett Sandra L | $120,000 | |
| Previous Owner | Pitts Donna H | $116,800 |
Source: Public Records
Tax History Compared to Growth
Tax History
| Year | Tax Paid | Tax Assessment Tax Assessment Total Assessment is a certain percentage of the fair market value that is determined by local assessors to be the total taxable value of land and additions on the property. | Land | Improvement |
|---|---|---|---|---|
| 2025 | $1,495 | $139,688 | $36,000 | $103,688 |
| 2024 | $1,498 | $139,688 | $36,000 | $103,688 |
| 2023 | $4,153 | $137,732 | $36,000 | $101,732 |
| 2022 | $3,241 | $106,800 | $26,000 | $80,800 |
| 2021 | $2,629 | $86,624 | $24,000 | $62,624 |
| 2020 | $2,629 | $86,624 | $24,000 | $62,624 |
| 2019 | $2,489 | $82,004 | $18,400 | $63,604 |
| 2018 | $2,295 | $75,628 | $18,400 | $57,228 |
| 2017 | $2,130 | $74,092 | $18,400 | $55,692 |
| 2016 | $1,723 | $59,936 | $17,200 | $42,736 |
| 2015 | $1,692 | $57,436 | $12,000 | $45,436 |
| 2014 | $1,706 | $57,436 | $0 | $0 |
Source: Public Records
Map
Nearby Homes
- 4592 N Landing Dr
- 4509 N Bay Ct
- 4509 N Landing Dr
- 4797 North Trail
- 4799 North Trail
- 1765 Blackwillow Dr
- 4813 Highpoint Dr NE
- 4709 Trickum Rd NE
- 4924 Locklear Way
- 4314 Keheley Lake Ct NE
- 4499 Browning Ct NE
- 1634 Barrier Rd
- 5009 Kingsley Manor Ct
- 4758 Jamerson Forest Cir
- 2256 Turtle Club Dr NE Unit 1
- 4281 Keheley Lake Dr NE
- 1513 Jamerson Landing
- 2008 N Sound Trail
- 2116 N Sound Trail
- 2005 N Cove Ct
- 2001 N Cove Ct
- 2007 N Sound Trail
- 2009 N Cove Ct
- 2120 N Sound Trail Unit 4B
- 4575 N Landing Dr
- 2003 N Sound Trail
- 4653 N Landing Dr
- 2013 N Cove Ct
- 2004 N Sound Trail Unit 4B
- 4583 N Landing Dr Unit 4B
- 4647 N Landing Dr Unit 4647
- 4647 N Landing Dr
- 4647 N Landing Dr Unit 3
- 4643 N Landing Dr
- 4657 N Landing Dr Unit 3
- 4637 N Landing Dr
- 4591 N Landing Dr Unit 4